
As identified by the just released HIA New Home Sales Report, “new home sales in the first three months of 2022 remained exceptionally strong, down by 2.8 per cent on the previous quarter, but still remaining well above pre-pandemic levels. Despite a difficult start to the year, with staff absences associated with the Omicron outbreak and extended holiday leave, new home sales continue to sustain levels usually associated with government stimulus. This demand continues to be driven by a shortage of homes and an acutely tight rental market that has resulted in rapid house price and rental price growth. Tighter lending conditions have had minimal impact on the market to date.
Most states saw an increase in sales in March 2022. New South Wales and Western Australia saw declines, though New South Wales has still been leading the nation, with a significant amount of latent demand remaining unsatisfied after HomeBuilder. The volume of work under construction and approved but not yet commenced will continue to keep builders busy across Australia, supporting strong levels of employment into 2023. Even as borders re-open and the functioning of supply chains improves, the salient constraint on builders this year will continue to be the availability of land, labour and materials. Shortages of shovel-ready land are especially likely to weigh on new home sales in the coming months as the pool of available land has been exhausted. Add to this another strong result for the value of renovations approved and the key indicators point to a strong project pipeline for 2022 and beyond.”
Dahlsens will continue to monitor supply chain challenges and costs closely. We are working around the clock to leverage our buying power in order to supply as many customers as possible and to minimise price impacts from our suppliers. We are confident that we are well placed to meet demand particularly for framing timber, however, we do forecast shortages of LVL as a result of the Russia-Ukraine conflict. The strength of our key suppliers and majority Australian made products play an important role in our ability to meet customer demand.
We ask that forward orders are placed by our customers as soon as requirements are known to assist us to support you.
For your information, below is a compilation of news and updates compiled from referenced sources.
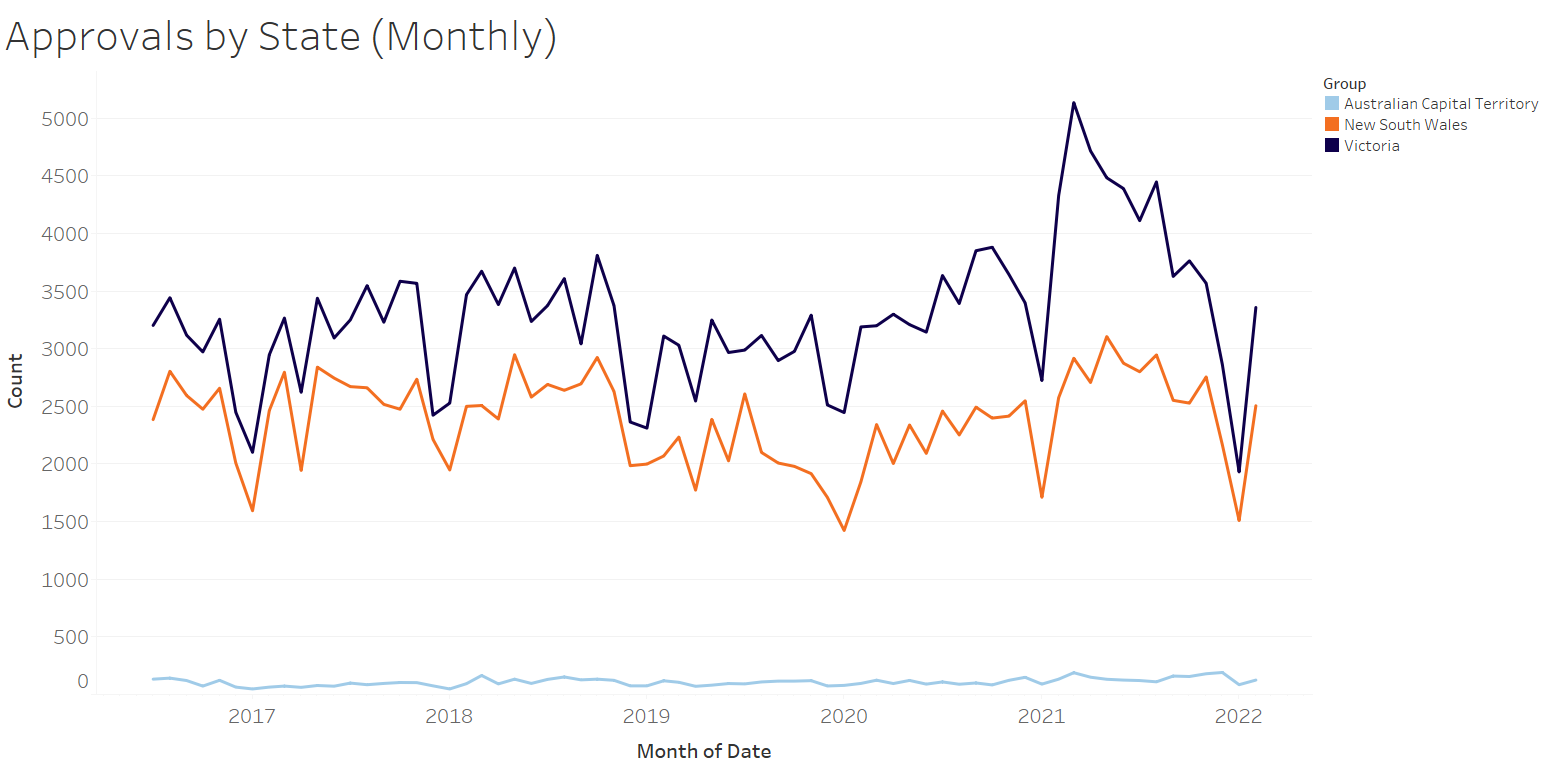
Scroll down for HIA Building Approvals Data, February 2022
INDUSTRY NEWS IN REVIEW
In the news: What’s in the Federal Budget for builders?
Master Builders Victoria (MBV) has welcomed the Federal Government’s announcement that it will be expanding its First Home Guarantee Scheme to help thousands more Victorians enter the property market.
MBV believes the scheme’s extension is another step in addressing housing affordability and will help more Victorians build and own their own home.
The Federal Government also announced last night it would commit an additional $2 billion in funding to NHFIC to support the delivery of affordable housing.
Meanwhile, MBV has welcomed the Commonwealth Government’s $365.3 million investment to support an extra 35,000 apprentices and trainees get into work, especially considering current skills shortages, including bricklayers, carpenters, and concreters.
MBV also supports the new Australian Apprenticeships Incentive Scheme from 1 July 2022, which will help address skills shortages by supporting employers and apprentices in priority occupations such as bricklayers, cabinet makers, carpenters, wall and floor tilers and roof plumbers.
$954 million will be provided over five years to support this. To encourage more women into trades, the Federal Government will provide $38.6 million over the next four years to allow additional support to women who commence trade occupations that are higher paying on the Australian Apprenticeships Priority List.
Article from 30th March 2022 Master Builders Association READ MORE
In the news: Boosting Apprenticeship Commencement Wage Subsidy
MBV welcomes the announcement from The Australian Government to extend the Boosting Apprenticeship Commencements (BAC) and the Completing Apprenticeship Commencements (CAC) wage support initiatives that support the recruitment of apprentices and trainees.
Enrolments for the Boosting Apprenticeship Commencement wage subsidy, which provides employers with 12 months of wage subsidy support, are being extended to the end of the 2021-22 financial year (June 30 2022).
Employers who take on an apprentice or trainee before June 30 will be able to have their wages subsidised by 50% for the first year – up to a maximum of $28,000. The wage subsidy will be reduced to 10% in the second year and 5% in the third year.
Article from 5th April 2022 Master Builders Association READ MORE
In the news: PEFC ruling on conflict timber to affect Australia for years to come
The decision by the world’s largest international forestry certifier to designate all timber originating from Russia and Belarus as ‘conflict timber’ banning this timber from being used in PEFC-certified products will have real and significant potential to impact on Australia’s construction needs in the decades to come. Source: Timberbiz
South Australian Forest Products Association CEO, Mr Nathan Paine said that with around 25% of Australia’s timber imports originating from Russia and former the Soviet Union or Russian-occupied countries of Belarus, Estonia, Latvia and Lithuania this ban in addition to future instability in the region will have a detrimental impact on using imports to meet South Australia’s constructions needs.
Article from 9th March 2022 Timberbiz READ MORE
Ministerial Media Release: New program aims to speed up regional NSW housing projects
The NSW Government announced $1m funding for the establishment of a panel of planning consultants to help manage development applications for new homes across regional NSW. The panel, with support from the NSW Department of Planning and Environment, was created in response to recommendations proposed by the Regional Housing Taskforce. Regional councils will now be able to nominate development applications that deliver regional housing, through a formal Expression of Interest process, which will be assessed by an evaluation panel for the flying squads to action.
NSW Government 2nd March 2022 READ MORE
New Policy: Victorian Government sets Gender Equality targets for new public sector projects
Effective 1 January 2022, The Victorian Government’s Building Equality Policy (BEP) mandates female employment targets on all new publicly funded projects worth $20 million or more. With $765m already committed to the ‘Big Housing Build’ across regional Victoria and another $485m not yet committed to local government areas through the Minimum Investment Guarantee, now is the time to develop your Gender Equality Action Plans if you’re planning on targeting public sector housing projects in 2022 and beyond.
Building Equality Policy Victorian Government READ MORE
New Program: Rebates for building 7 Star Homes Program
Sustainability Victoria’s 7 Star Homes is a new program that works with businesses and individuals across the building and construction supply chain to increase capability and capacity for delivering energy-efficient homes.
With proposed changes to the National Construction Code forecast for 2022, the 7 Star Homes program accelerates the transition to 7-star homes by:
- $4,000 rebates per home, for up to 4 homes built, to assist with upgrade costs
- as-built verification assessment to ensure homes are built to achieve the same efficiency rating as designed
- 6-to-7-star training, online and in person, to support the design process and to upskill employees
- exclusive sales and marketing training designed especially for selling energy-efficient homes.
Updated 15th March 2022 READ MORE
Changes to Occupational Health and Safety Act 2004: New rights and protections to labour hire workers in Victoria
Changes to the Occupational Health and Safety Act 2004 came into effect in Victoria on 22 March 2022 and have extended the definitions of ’employer’ and ’employee’ to ensure labour hire workers are considered employees of their host employer for the purposes of the OHS Act.
Worksafe Victoria has published guidance to support the amendments and to help employers familiarise themselves with their new duties. New Worksafe Victoria materials are also being prepared to support the amendments.
Updated 30h March 2022 READ MORE
In the news: Building The Good Life: RAI’s keys to addressing regional housing affordability issues
Incentives for country tradies and more diverse housing should combine with loan guarantees to boost affordable housing supply away from our capital cities, a new report recommends.
The Regional Australia Institute’s ‘Building The Good Life’ paper calls for a diverse approach to regional housing that ensures locals aren’t left behind amid mass migration to the regions.
It comes as the federal government matches Labor’s Regional First Home Buyer Support Scheme, which will give extra assistance to 10,000 families a year in regional areas.
Article from 29th March 2022 Realestate.com.au READ MORE
In the news: Lending for a new home remains well above pre-COVID levels
“This leaves the number of loans for new homes up by 11.4 per cent on pre-COVID levels,” said Mr Devitt.
“The value of lending fell by 3.7% in February but remains well above the value of lending in previous years.
“The pandemic trend of homebuyers seeking more space and amenity continues to be reflected in the data almost a year after the end of the HomeBuilder grant.
Article from 1st April 2022 HIA READ MORE
In the news: Victoria breaks building permit records in 2021
More than 12,700 building permits were issued in 2021, the first time domestic permits have topped 100,000 in a calendar year in Victoria.
Victorian Building Authority (VBA) data shows 127,792 building permits, worth $44.6 billion were issued in 2021, an increase of more than 14,000 (or 12.66 per cent) from the previous year.
The cost of domestic building permits issued increased by more than $4.3 billion, up from 96,367 in 2020 to 109,367 in 2021.
Article from 1st February 2022 Inside Construction READ MORE
In the news: Mildura, Ballarat, Bendigo: How development has changed regional Vic
If you didn’t see it, you wouldn’t believe it. Stunning aerial photographs reveal just how much country Victoria has changed in the past decade.
Victoria is pegged as the fastest growing state in Australia with aerial photos released from Nearmap showing why.
Since 2011 the state has recorded one million new residents and is expected to add another million by 2026.
And now people are leaving the city to move to fringe suburbs or to regional Victoria.
The latest Future Victoria predictions show that by 2056 regional Victoria’s population will expand from 1.5 million in 2018 to 2.2 million in 2026.
These images, courtesy of Nearmap, reveal the stark changes seen in regional areas and showcase a decade of growth.
Article from 29th January 2022 Herald Sun READ MORE
STATE & REGIONAL HOUSING APPROVALS
Housing Approvals data provided by HIA, January 2022
(scroll down the lists below to find regions in Victoria and New South Wales)
Vic and NSW – Single Detached Houses Approvals
| Location | State | Feb-22 | Feb-21 | % Difference Month |
Rolling 12 Months |
Previous Rolling 12 Months |
12 Month Variance |
| Victoria | VIC | 3358 | 4328 | -22.41% | 46389 | 41701 | 11.24% |
| Ballarat | VIC | 136 | 222 | -38.74% | 1821 | 1642 | 10.90% |
| Baw Baw | VIC | 73 | 85 | -14.12% | 934 | 686 | 36.15% |
| Bendigo | VIC | 79 | 165 | -52.12% | 1451 | 1428 | 1.61% |
| Campaspe | VIC | 6 | 23 | -73.91% | 164 | 202 | -18.81% |
| Geelong | VIC | 205 | 277 | -25.99% | 2302 | 2221 | 3.65% |
| Gippsland – East | VIC | 33 | 53 | -37.74% | 491 | 472 | 4.03% |
| Gippsland – South West | VIC | 68 | 114 | -40.35% | 1037 | 961 | 7.91% |
| Grampians | VIC | 18 | 33 | -45.45% | 203 | 206 | -1.46% |
| Greater Melbourne | VIC | 2221 | 2698 | -17.68% | 30873 | 27582 | 11.93% |
| Latrobe Valley | VIC | 29 | 42 | -30.95% | 502 | 456 | 10.09% |
| Melbourne – Inner | VIC | 34 | 35 | -2.86% | 379 | 323 | 17.34% |
| Melbourne – Inner East (Boroondara, Manningham, Whitehorse) | VIC | 69 | 48 | 43.75% | 758 | 637 | 19.00% |
| Melbourne – Inner South (Bayside, Glen Eira, Kingston, Stonnington – East) | VIC | 60 | 64 | -6.25% | 608 | 595 | 2.18% |
| Melbourne – North East (Banyule, Darebin – North, Kinglake, Whittlesea) | VIC | 275 | 390 | -29.49% | 3999 | 3467 | 15.34% |
| Melbourne – North West (Keilor, Macedon Ranges, Moreland – North, Sunbury, Tullamarine) | VIC | 272 | 347 | -21.61% | 4156 | 4017 | 3.46% |
| Melbourne – Outer East (Knox, Manningham, Maroondah, Whitehore – East, Yarra Ranges) | VIC | 74 | 103 | -28.16% | 1132 | 1041 | 8.74% |
| Melbourne – South East (Cardinia, Casey-North, Casey-South, Dandenong, Monash) | VIC | 476 | 601 | -20.80% | 6484 | 5618 | 15.41% |
| Melbourne – West (Brimbank, Hobsons Bay, Maribyrnong, Melton – Bacchus Marsh, Wyndham) | VIC | 895 | 996 | -10.14% | 12448 | 10988 | 13.29% |
| Mildura | VIC | 31 | 32 | -3.13% | 315 | 333 | -5.41% |
| Mornington Peninsula – Frankston | VIC | 66 | 114 | -42.11% | 909 | 896 | 1.45% |
| Murray River – Swan Hill | VIC | 7 | 18 | -61.11% | 144 | 154 | -6.49% |
| Shepparton | VIC | 30 | 52 | -42.31% | 551 | 466 | 18.24% |
| Surf Coast – Bellarine Peninsula | VIC | 165 | 171 | -3.51% | 2051 | 1646 | 24.61% |
| Upper Goulburn Valley | VIC | 50 | 53 | -5.66% | 630 | 417 | 51.08% |
| Wangaratta – Benalla | VIC | 14 | 27 | -48.15% | 340 | 294 | 15.65% |
| Warrnambool | VIC | 21 | 26 | -19.23% | 332 | 400 | -17.00% |
| Wellington | VIC | 23 | 40 | -42.50% | 329 | 298 | 10.40% |
| Wodonga – Alpine | VIC | 36 | 79 | -54.43% | 676 | 704 | -3.98% |
| New South Wales | NSW | 2505 | 2575 | -2.72% | 31364 | 27627 | 13.53% |
| Albury | NSW | 61 | 66 | -7.58% | 578 | 533 | 8.44% |
| Bathurst | NSW | 23 | 31 | -25.81% | 258 | 280 | -7.86% |
| Central Coast | NSW | 44 | 115 | -61.74% | 970 | 847 | 14.52% |
| Coffs Harbour | NSW | 18 | 34 | -47.06% | 304 | 356 | -14.61% |
| Dapto – Port Kembla | NSW | 9 | 38 | -76.32% | 310 | 415 | -25.30% |
| Dubbo | NSW | 34 | 40 | -15.00% | 351 | 294 | 19.39% |
| Gosford | NSW | 19 | 34 | -44.12% | 347 | 283 | 22.61% |
| Goulburn | NSW | 24 | 39 | -38.46% | 326 | 217 | 50.23% |
| Greater Sydney | NSW | 1378 | 1441 | -4.37% | 17996 | 16336 | 10.16% |
| Griffith | NSW | 21 | 19 | 10.53% | 182 | 120 | 51.67% |
| Kiama – Shellharbour | NSW | 37 | 29 | 27.59% | 496 | 481 | 3.12% |
| Lake Macquarie | NSW | 39 | 56 | -30.36% | 1072 | 942 | 13.80% |
| Lower Hunter | NSW | 69 | 76 | -9.21% | 966 | 773 | 24.97% |
| Maitland | NSW | 75 | 64 | 17.19% | 932 | 867 | 7.50% |
| Newcastle | NSW | 14 | 30 | -53.33% | 280 | 363 | -22.87% |
| Orange | NSW | 36 | 6 | 500.00% | 324 | 239 | 35.56% |
| Port Macquarie | NSW | 44 | 55 | -20.00% | 504 | 382 | 31.94% |
| Port Stephens | NSW | 41 | 36 | 13.89% | 437 | 252 | 73.41% |
| Rest of NSW | NSW | 1127 | 1134 | -0.62% | 13368 | 11291 | 18.40% |
| Richmond – Tweed | NSW | 54 | 92 | -41.30% | 992 | 813 | 22.02% |
| Shoalhaven | NSW | 51 | 75 | -32.00% | 631 | 582 | 8.42% |
| South Coast – Batemas Bay, Bega, Merimbula | NSW | 35 | 32 | 9.38% | 406 | 390 | 4.10% |
| Southern Highlands | NSW | 32 | 22 | 45.45% | 303 | 189 | 60.32% |
| Sydney – Baulkham Hills and Hawkesbury | NSW | 191 | 151 | 26.49% | 2179 | 1750 | 24.51% |
| Sydney – Blacktown | NSW | 230 | 271 | -15.13% | 3378 | 3347 | 0.93% |
| Sydney – City and Inner South | NSW | 6 | 7 | -14.29% | 98 | 102 | -3.92% |
| Sydney – Eastern Suburbs (Bondi, Coogee, Randwick) | NSW | 25 | 13 | 92.31% | 161 | 134 | 20.15% |
| Sydney – Inner South West | NSW | 69 | 102 | -32.35% | 995 | 977 | 1.84% |
| Sydney – Inner West (Canada Bay, Leichhardt, Strathfield) | NSW | 25 | 25 | 0.00% | 309 | 295 | 4.75% |
| Sydney – North Sydney (Chatswood, Hornsby, Mosman) | NSW | 71 | 44 | 61.36% | 569 | 458 | 24.24% |
| Sydney – Northern Beaches (Manly, Pittwater, Warringah) | NSW | 22 | 42 | -47.62% | 450 | 424 | 6.13% |
| Sydney – Outer South West (Camden, Campbelltown, Wollondilly) | NSW | 136 | 178 | -23.60% | 1654 | 2206 | -25.02% |
| Sydney – Parramatta | NSW | 69 | 90 | -23.33% | 855 | 844 | 1.30% |
| Sydney – Penrith, Richmond, Blue Mountains | NSW | 90 | 72 | 25.00% | 1037 | 1009 | 2.78% |
| Sydney – Ryde | NSW | 47 | 26 | 80.77% | 512 | 333 | 53.75% |
| Sydney – South West (Bringelly, Fairfield, Liverpool) | NSW | 325 | 279 | 16.49% | 4482 | 3381 | 32.56% |
| Sydney – Sutherland | NSW | 28 | 26 | 7.69% | 347 | 229 | 51.53% |
| Tamworth | NSW | 24 | 30 | -20.00% | 275 | 241 | 14.11% |
| Taree – Gloucester | NSW | 26 | 28 | -7.14% | 369 | 239 | 54.39% |
| Wagga Wagga | NSW | 40 | 50 | -20.00% | 549 | 482 | 13.90% |
| Wollongong | NSW | 9 | 19 | -52.63% | 229 | 225 | 1.78% |
| Wyong | NSW | 25 | 81 | -69.14% | 623 | 564 | 10.46% |
| Australian Capital Territory | ACT | 125 | 133 | -6.02% | 1724 | 1307 | 31.91% |
Vic and NSW – Units and Apartment Approvals
| Location | State | Feb-22 | Feb-21 | % Difference Month |
Rolling 12 Months |
Previous Rolling 12 Months |
12 Month Variance |
| Victoria | VIC | 3860 | 1544 | 150.00% | 25319 | 19553 | 29.49% |
| Ballarat | VIC | 18 | 18 | 0.00% | 140 | 157 | -10.83% |
| Baw Baw | VIC | 4 | 0 | 79 | 3 | 2533.33% | |
| Bendigo | VIC | 0 | 1 | -100.00% | 83 | 40 | 107.50% |
| Campaspe | VIC | 2 | 0 | 13 | 7 | 85.71% | |
| Geelong | VIC | 25 | 90 | -72.22% | 422 | 326 | 29.45% |
| Gippsland – East | VIC | 3 | 0 | 13 | |||
| Gippsland – South West | VIC | 16 | 5 | 220.00% | 37 | 39 | -5.13% |
| Grampians | VIC | 0 | 0 | 33 | 12 | 175.00% | |
| Greater Melbourne | VIC | 3719 | 1373 | 170.87% | 23792 | 18529 | 28.40% |
| Latrobe Valley | VIC | 0 | 0 | 22 | 45 | -51.11% | |
| Melbourne – Inner | VIC | 1804 | 262 | 588.55% | 7193 | 5851 | 22.94% |
| Melbourne – Inner East (Boroondara, Manningham, Whitehorse) | VIC | 331 | 131 | 152.67% | 2920 | 1890 | 54.50% |
| Melbourne – Inner South (Bayside, Glen Eira, Kingston, Stonnington – East) | VIC | 419 | 119 | 252.10% | 3118 | 2365 | 31.84% |
| Melbourne – North East (Banyule, Darebin – North, Kinglake, Whittlesea) | VIC | 606 | 81 | 648.15% | 2535 | 1672 | 51.61% |
| Melbourne – North West (Keilor, Macedon Ranges, Moreland – North, Sunbury, Tullamarine) | VIC | 188 | 79 | 137.97% | 1269 | 1004 | 26.39% |
| Melbourne – Outer East (Knox, Manningham, Maroondah, Whitehore – East, Yarra Ranges) | VIC | 76 | 58 | 31.03% | 1347 | 970 | 38.87% |
| Melbourne – South East (Cardinia, Casey-North, Casey-South, Dandenong, Monash) | VIC | 123 | 185 | -33.51% | 2081 | 1904 | 9.30% |
| Melbourne – West (Brimbank, Hobsons Bay, Maribyrnong, Melton – Bacchus Marsh, Wyndham) | VIC | 116 | 411 | -71.78% | 2604 | 2431 | 7.12% |
| Mildura | VIC | 0 | 0 | 17 | 20 | -15.00% | |
| Mornington Peninsula – Frankston | VIC | 56 | 47 | 19.15% | 725 | 442 | 64.03% |
| Murray River – Swan Hill | VIC | 0 | 0 | 24 | 6 | 300.00% | |
| Shepparton | VIC | 7 | 0 | 78 | 14 | 457.14% | |
| Surf Coast – Bellarine Peninsula | VIC | 30 | 53 | -43.40% | 211 | 254 | -16.93% |
| Upper Goulburn Valley | VIC | 4 | 0 | 32 | 25 | 28.00% | |
| Wangaratta – Benalla | VIC | 15 | 0 | 85 | 14 | 507.14% | |
| Warrnambool | VIC | 2 | 0 | 93 | 11 | 745.45% | |
| Wellington | VIC | 0 | 0 | 24 | 2 | 1100.00% | |
| Wodonga – Alpine | VIC | 7 | 2 | 250.00% | 30 | 6 | 400.00% |
| New South Wales | NSW | 2596 | 2112 | 22.92% | 30904 | 23862 | 29.51% |
| Albury | NSW | 2 | 6 | -66.67% | 40 | 22 | 81.82% |
| Bathurst | NSW | 2 | 10 | -80.00% | 28 | 80 | -65.00% |
| Central Coast | NSW | 71 | 16 | 343.75% | 572 | 344 | 66.28% |
| Coffs Harbour | NSW | 8 | 24 | -66.67% | 179 | 93 | 92.47% |
| Dapto – Port Kembla | NSW | 4 | 8 | -50.00% | 255 | 264 | -3.41% |
| Dubbo | NSW | 0 | 4 | -100.00% | 73 | 52 | 40.38% |
| Gosford | NSW | 65 | 4 | 1525.00% | 387 | 192 | 101.56% |
| Goulburn | NSW | 12 | 2 | 500.00% | 71 | 77 | -7.79% |
| Greater Sydney | NSW | 2188 | 1752 | 24.89% | 25192 | 19766 | 27.45% |
| Griffith | NSW | 2 | 2 | 0.00% | 26 | 16 | 62.50% |
| Kiama – Shellharbour | NSW | 50 | 157 | -68.15% | 601 | 528 | 13.83% |
| Lake Macquarie | NSW | 39 | 16 | 143.75% | 510 | 316 | 61.39% |
| Lower Hunter | NSW | 18 | 8 | 125.00% | 139 | 70 | 98.57% |
| Maitland | NSW | 28 | 12 | 133.33% | 369 | 342 | 7.89% |
| Newcastle | NSW | 26 | 27 | -3.70% | 723 | 485 | 49.07% |
| Orange | NSW | 2 | 2 | 0.00% | 66 | 37 | 78.38% |
| Port Macquarie | NSW | 14 | 23 | -39.13% | 222 | 200 | 11.00% |
| Port Stephens | NSW | 16 | 7 | 128.57% | 345 | 69 | 400.00% |
| Rest of NSW | NSW | 408 | 360 | 13.33% | 5712 | 4096 | 39.45% |
| Richmond – Tweed | NSW | 32 | 4 | 700.00% | 331 | 315 | 5.08% |
| Shoalhaven | NSW | 30 | 20 | 50.00% | 212 | 251 | -15.54% |
| South Coast – Batemas Bay, Bega, Merimbula | NSW | 4 | 0 | 46 | 107 | -57.01% | |
| Southern Highlands | NSW | 2 | 0 | 272 | 15 | 1713.33% | |
| Sydney – Baulkham Hills and Hawkesbury | NSW | 8 | 17 | -52.94% | 2353 | 743 | 216.69% |
| Sydney – Blacktown | NSW | 170 | 245 | -30.61% | 3879 | 2704 | 43.45% |
| Sydney – City and Inner South | NSW | 4 | 708 | -99.44% | 1999 | 2966 | -32.60% |
| Sydney – Eastern Suburbs (Bondi, Coogee, Randwick) | NSW | 30 | 16 | 87.50% | 731 | 319 | 129.15% |
| Sydney – Inner South West | NSW | 135 | 135 | 0.00% | 1966 | 2622 | -25.02% |
| Sydney – Inner West (Canada Bay, Leichhardt, Strathfield) | NSW | 12 | 28 | -57.14% | 1059 | 700 | 51.29% |
| Sydney – North Sydney (Chatswood, Hornsby, Mosman) | NSW | 340 | 34 | 900.00% | 909 | 1139 | -20.19% |
| Sydney – Northern Beaches (Manly, Pittwater, Warringah) | NSW | 8 | 104 | -92.31% | 281 | 383 | -26.63% |
| Sydney – Outer South West (Camden, Campbelltown, Wollondilly) | NSW | 100 | 22 | 354.55% | 806 | 707 | 14.00% |
| Sydney – Parramatta | NSW | 676 | 132 | 412.12% | 5583 | 3141 | 77.75% |
| Sydney – Penrith, Richmond, Blue Mountains | NSW | 463 | 51 | 807.84% | 815 | 622 | 31.03% |
| Sydney – Ryde | NSW | 60 | 78 | -23.08% | 1959 | 1020 | 92.06% |
| Sydney – South West (Bringelly, Fairfield, Liverpool) | NSW | 45 | 71 | -36.62% | 1161 | 1524 | -23.82% |
| Sydney – Sutherland | NSW | 66 | 95 | -30.53% | 1119 | 832 | 34.50% |
| Tamworth | NSW | 24 | 4 | 500.00% | 110 | 45 | 144.44% |
| Taree – Gloucester | NSW | 5 | 4 | 25.00% | 60 | 10 | 500.00% |
| Wagga Wagga | NSW | 6 | 6 | 0.00% | 89 | 57 | 56.14% |
| Wollongong | NSW | 60 | 4 | 1400.00% | 489 | 435 | 12.41% |
| Wyong | NSW | 6 | 12 | -50.00% | 185 | 152 | 21.71% |
| Australian Capital Territory | ACT | 422 | 270 | 56.30% | 3899 | 3680 | 5.95% |