
The advice from Dahlsens is that the availability of many building products has improved significantly over the past couple of months. This improvement can be attributed to the increase in overseas shipping movements and an increase in production. The volume and frequency of cost increases from suppliers has definitely slowed and we are beginning to find supply options that are providing us with the opportunity to reduce some cost prices in the market. We are anticipating that there will be further reductions in building materials which are sourced from overseas in the coming weeks. Dahlsens continues to remain in constant conversation with suppliers and manufacturers in order to find ways to reduce the impact of the inflationary markets that we have seen in the past year. Customers can be assured that we will advise you accordingly as these reductions flow through.
The news from the Australian Building Codes Board, confirming the increase from 6 to 7 stars in the 2022 edition of the NCC, will likely put further pressure on the cost of building a home. Said to be a much bigger leap forward than 5 to 6 stars, Dahlsens understands the impact that this change will have on the industry and is committed to supporting builders along the way. We are working closely with our supply partners to provide customers with innovative and efficient solutions to reach 7 stars.
“New home sales fell by 1.6 per cent in August after the 13.1 per cent decline seen in July”, according to the just released HIA New Home Sales Report. “This makes July and August the weakest pair of months nationally since the Delta lockdowns a year ago. This confirms the beginning of a new cycle for the industry. Interest rate increases from the RBA have compounded the effect of surging construction costs to bring an end to the pandemic boom in housing demand.”
The HIA reported “The RBA also lifted interest rates in September, anticipating further increases will be required in the months ahead. The full impact of recent and future increases will continue to flow through as an adverse impact on the sale of new homes in the coming months. Despite the fall in sales, there remains a significant volume of home building work still under construction, and many more projects still awaiting commencement. This will ensure building activity and demand for skilled trades remains exceptionally strong through the rest of 2022 and into 2023.”
The HIA reported that “recent data also points to the gradual return of people from overseas, particularly permanent and long-term arrivals. This has the potential to help ease ongoing labour constraints facing the industry. This large volume of work still to be completed will provide a buffer for the industry. There remains a risk, however, that the adverse impact of rising rates on the wider economy will be obscured by the volume of ongoing work and that the RBA goes too far, too soon.”
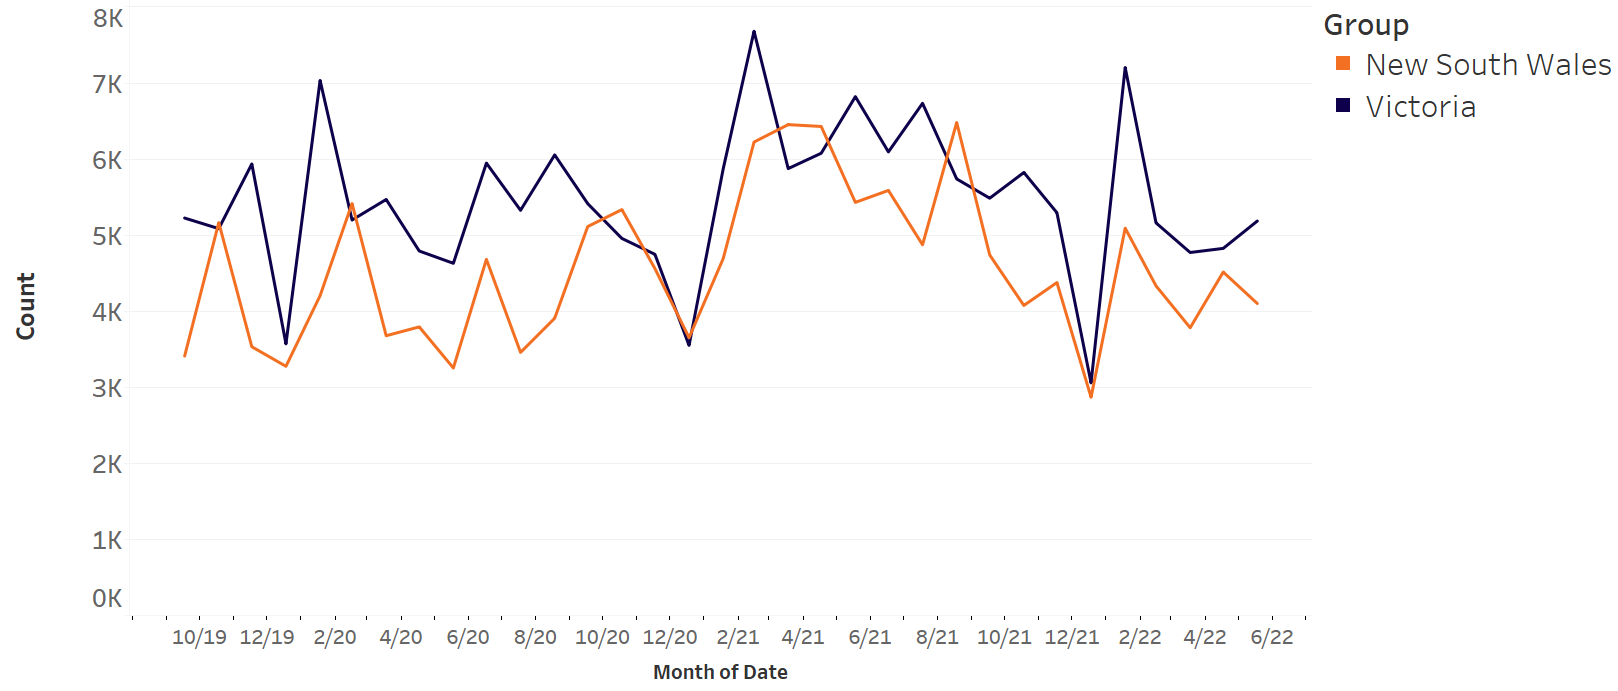
“Victoria drove the declines in sales in August, down by 15.2 per cent, followed by Queensland (-1.8 per cent). The other states saw increases, including South Australia (+18.2 per cent), New South Wales (+14.2 per cent) and Western Australia (+7.5 per cent). Compared to the same month last year, most of the large states were up, led by Queensland (+11.3 per cent) and followed by Victoria (+8.6 per cent) and South Australia (+3.4 per cent). Western Australia (-21.4 per cent) and New South Wales (-10.2 per cent) were down on the same month in 2021”, according to the HIA.
STATE & REGIONAL HOUSING APPROVALS
Housing Approvals data provided by HIA, July 2022
(scroll down the lists below to find regions in Victoria and New South Wales)
Vic and NSW – Single Detached Houses Approvals
| Location | State | Jul-22 | Jul-21 | % Difference Month |
Rolling 12 Months |
Previous Rolling 12 Months |
12 Month Variance |
| Ballarat | VIC | 118 | 163 | -27.61% | 1552 | 1993 | -22.13% |
| Baw Baw | VIC | 70 | 79 | -11.39% | 710 | 966 | -26.50% |
| Bendigo | VIC | 86 | 119 | -27.73% | 1155 | 1599 | -27.77% |
| Campaspe | VIC | 12 | 16 | -25.00% | 102 | 232 | -56.03% |
| Geelong | VIC | 120 | 187 | -35.83% | 1845 | 2546 | -27.53% |
| Gippsland – East | VIC | 27 | 38 | -28.95% | 438 | 542 | -19.19% |
| Gippsland – South West | VIC | 58 | 86 | -32.56% | 858 | 1167 | -26.48% |
| Grampians | VIC | 14 | 11 | 27.27% | 185 | 229 | -19.21% |
| Greater Melbourne | VIC | 2302 | 2772 | -16.96% | 26368 | 30772 | -14.31% |
| Latrobe Valley | VIC | 31 | 44 | -29.55% | 393 | 615 | -36.10% |
| Melbourne – Inner | VIC | 26 | 35 | -25.71% | 373 | 343 | 8.75% |
| Melbourne – Inner East (Boroondara, Manningham, Whitehorse) | VIC | 62 | 66 | -6.06% | 743 | 680 | 9.26% |
| Melbourne – Inner South (Bayside, Glen Eira, Kingston, Stonnington – East) | VIC | 44 | 65 | -32.31% | 638 | 604 | 5.63% |
| Melbourne – North East (Banyule, Darebin – North, Kinglake, Whittlesea) | VIC | 350 | 400 | -12.50% | 3131 | 3992 | -21.57% |
| Melbourne – North West (Keilor, Macedon Ranges, Moreland – North, Sunbury, Tullamarine) | VIC | 261 | 311 | -16.08% | 3461 | 4259 | -18.74% |
| Melbourne – Outer East (Knox, Manningham, Maroondah, Whitehore – East, Yarra Ranges) | VIC | 77 | 84 | -8.33% | 1067 | 1145 | -6.81% |
| Melbourne – South East (Cardinia, Casey-North, Casey-South, Dandenong, Monash) | VIC | 544 | 594 | -8.42% | 5738 | 6367 | -9.88% |
| Melbourne – West (Brimbank, Hobsons Bay, Maribyrnong, Melton – Bacchus Marsh, Wyndham) | VIC | 868 | 1128 | -23.05% | 10301 | 12444 | -17.22% |
| Mildura | VIC | 26 | 28 | -7.14% | 278 | 396 | -29.80% |
| Mornington Peninsula – Frankston | VIC | 70 | 89 | -21.35% | 916 | 938 | -2.35% |
| Murray River – Swan Hill | VIC | 6 | 13 | -53.85% | 118 | 178 | -33.71% |
| Shepparton | VIC | 22 | 49 | -55.10% | 400 | 604 | -33.77% |
| Surf Coast – Bellarine Peninsula | VIC | 98 | 159 | -38.36% | 1816 | 2050 | -11.41% |
| Upper Goulburn Valley | VIC | 58 | 55 | 5.45% | 585 | 558 | 4.84% |
| Victoria | VIC | 3250 | 4070 | -20.15% | 39260 | 47755 | -17.79% |
| Wangaratta – Benalla | VIC | 27 | 21 | 28.57% | 288 | 341 | -15.54% |
| Warrnambool | VIC | 30 | 23 | 30.43% | 288 | 417 | -30.94% |
| Wellington | VIC | 30 | 42 | -28.57% | 286 | 399 | -28.32% |
| Wodonga – Alpine | VIC | 25 | 51 | -50.98% | 454 | 832 | -45.43% |
| Albury | NSW | 41 | 44 | -6.82% | 451 | 638 | -29.31% |
| Bathurst | NSW | 11 | 19 | -42.11% | 227 | 321 | -29.28% |
| Central Coast | NSW | 63 | 125 | -49.60% | 753 | 1047 | -28.08% |
| Coffs Harbour | NSW | 13 | 20 | -35.00% | 236 | 387 | -39.02% |
| Dapto – Port Kembla | NSW | 32 | 32 | 0.00% | 230 | 438 | -47.49% |
| Dubbo | NSW | 65 | 35 | 85.71% | 333 | 415 | -19.76% |
| Gosford | NSW | 20 | 42 | -52.38% | 326 | 326 | 0.00% |
| Goulburn | NSW | 30 | 34 | -11.76% | 303 | 292 | 3.77% |
| Greater Sydney | NSW | 1353 | 1499 | -9.74% | 16473 | 17885 | -7.89% |
| Griffith | NSW | 13 | 10 | 30.00% | 182 | 130 | 40.00% |
| Kiama – Shellharbour | NSW | 24 | 68 | -64.71% | 398 | 571 | -30.30% |
| Lake Macquarie | NSW | 97 | 125 | -22.40% | 976 | 1008 | -3.17% |
| Lower Hunter | NSW | 65 | 74 | -12.16% | 912 | 924 | -1.30% |
| Maitland | NSW | 49 | 49 | 0.00% | 847 | 752 | 12.63% |
| New South Wales | NSW | 2357 | 2890 | -18.44% | 28863 | 30921 | -6.66% |
| Newcastle | NSW | 15 | 22 | -31.82% | 211 | 342 | -38.30% |
| Orange | NSW | 33 | 23 | 43.48% | 300 | 279 | 7.53% |
| Port Macquarie | NSW | 53 | 54 | -1.85% | 558 | 436 | 27.98% |
| Port Stephens | NSW | 35 | 54 | -35.19% | 499 | 374 | 33.42% |
| Rest of NSW | NSW | 1004 | 1391 | -27.82% | 12390 | 13036 | -4.96% |
| Richmond – Tweed | NSW | 61 | 182 | -66.48% | 736 | 1015 | -27.49% |
| Shoalhaven | NSW | 44 | 60 | -26.67% | 641 | 633 | 1.26% |
| South Coast – Batemas Bay, Bega, Merimbula | NSW | 18 | 37 | -51.35% | 354 | 425 | -16.71% |
| Southern Highlands | NSW | 19 | 32 | -40.63% | 318 | 204 | 55.88% |
| Sydney – Baulkham Hills and Hawkesbury | NSW | 125 | 171 | -26.90% | 1678 | 2286 | -26.60% |
| Sydney – Blacktown | NSW | 144 | 273 | -47.25% | 2568 | 3509 | -26.82% |
| Sydney – City and Inner South | NSW | 4 | 6 | -33.33% | 82 | 96 | -14.58% |
| Sydney – Eastern Suburbs (Bondi, Coogee, Randwick) | NSW | 13 | 14 | -7.14% | 163 | 125 | 30.40% |
| Sydney – Inner South West | NSW | 80 | 71 | 12.68% | 928 | 1014 | -8.48% |
| Sydney – Inner West (Canada Bay, Leichhardt, Strathfield) | NSW | 21 | 17 | 23.53% | 305 | 284 | 7.39% |
| Sydney – North Sydney (Chatswood, Hornsby, Mosman) | NSW | 50 | 33 | 51.52% | 639 | 489 | 30.67% |
| Sydney – Northern Beaches (Manly, Pittwater, Warringah) | NSW | 45 | 62 | -27.42% | 459 | 462 | -0.65% |
| Sydney – Outer South West (Camden, Campbelltown, Wollondilly) | NSW | 175 | 167 | 4.79% | 1692 | 2135 | -20.75% |
| Sydney – Parramatta | NSW | 92 | 70 | 31.43% | 902 | 868 | 3.92% |
| Sydney – Penrith, Richmond, Blue Mountains | NSW | 93 | 90 | 3.33% | 1060 | 1047 | 1.24% |
| Sydney – Ryde | NSW | 29 | 35 | -17.14% | 537 | 340 | 57.94% |
| Sydney – South West (Bringelly, Fairfield, Liverpool) | NSW | 392 | 336 | 16.67% | 4390 | 3857 | 13.82% |
| Sydney – Sutherland | NSW | 27 | 29 | -6.90% | 317 | 326 | -2.76% |
| Tamworth | NSW | 30 | 18 | 66.67% | 263 | 307 | -14.33% |
| Taree – Gloucester | NSW | 17 | 53 | -67.92% | 275 | 348 | -20.98% |
| Wagga Wagga | NSW | 39 | 62 | -37.10% | 496 | 576 | -13.89% |
| Wollongong | NSW | 15 | 22 | -31.82% | 229 | 231 | -0.87% |
| Wyong | NSW | 43 | 83 | -48.19% | 427 | 721 | -40.78% |
| Australian Capital Territory | ACT | 115 | 121 | -4.96% | 1614 | 1484 | 8.76% |
Vic and NSW – Units and Apartment Approvals
| Location | State | Jul-22 | Jul-21 | % Difference Month |
Rolling 12 Months |
Previous Rolling 12 Months |
12 Month Variance |
| Ballarat | VIC | 16 | 28 | -42.86% | 143 | 190 | -24.74% |
| Baw Baw | VIC | 4 | 2 | 100.00% | 45 | 50 | -10.00% |
| Bendigo | VIC | 4 | 7 | -42.86% | 130 | 28 | 364.29% |
| Campaspe | VIC | 0 | 3 | -100.00% | 6 | 11 | -45.45% |
| Geelong | VIC | 24 | 83 | -71.08% | 407 | 490 | -16.94% |
| Gippsland – East | VIC | 3 | 2 | 50.00% | 29 | 10 | 190.00% |
| Gippsland – South West | VIC | 0 | 2 | -100.00% | 48 | 40 | 20.00% |
| Grampians | VIC | 2 | 5 | -60.00% | 24 | 31 | -22.58% |
| Greater Melbourne | VIC | 928 | 1650 | -43.76% | 23077 | 18907 | 22.06% |
| Latrobe Valley | VIC | 2 | 2 | 0.00% | 14 | 22 | -36.36% |
| Melbourne – Inner | VIC | 69 | 452 | -84.73% | 7259 | 4608 | 57.53% |
| Melbourne – Inner East (Boroondara, Manningham, Whitehorse) | VIC | 89 | 118 | -24.58% | 2334 | 2359 | -1.06% |
| Melbourne – Inner South (Bayside, Glen Eira, Kingston, Stonnington – East) | VIC | 101 | 275 | -63.27% | 2727 | 2883 | -5.41% |
| Melbourne – North East (Banyule, Darebin – North, Kinglake, Whittlesea) | VIC | 90 | 176 | -48.86% | 2806 | 1759 | 59.52% |
| Melbourne – North West (Keilor, Macedon Ranges, Moreland – North, Sunbury, Tullamarine) | VIC | 67 | 117 | -42.74% | 1438 | 1062 | 35.40% |
| Melbourne – Outer East (Knox, Manningham, Maroondah, Whitehore – East, Yarra Ranges) | VIC | 84 | 100 | -16.00% | 1361 | 1163 | 17.02% |
| Melbourne – South East (Cardinia, Casey-North, Casey-South, Dandenong, Monash) | VIC | 107 | 142 | -24.65% | 2167 | 1692 | 28.07% |
| Melbourne – West (Brimbank, Hobsons Bay, Maribyrnong, Melton – Bacchus Marsh, Wyndham) | VIC | 237 | 173 | 36.99% | 2217 | 2839 | -21.91% |
| Mildura | VIC | 2 | 0 | Inf | 20 | 12 | 66.67% |
| Mornington Peninsula – Frankston | VIC | 84 | 97 | -13.40% | 768 | 542 | 41.70% |
| Murray River – Swan Hill | VIC | 4 | 0 | Inf | 28 | 13 | 115.38% |
| Shepparton | VIC | 3 | 0 | Inf | 71 | 38 | 86.84% |
| Surf Coast – Bellarine Peninsula | VIC | 2 | 30 | -93.33% | 142 | 422 | -66.35% |
| Upper Goulburn Valley | VIC | 5 | 9 | -44.44% | 58 | 30 | 93.33% |
| Victoria | VIC | 1001 | 1855 | -46.04% | 24419 | 20548 | 18.84% |
| Wangaratta – Benalla | VIC | 0 | 8 | -100.00% | 50 | 55 | -9.09% |
| Warrnambool | VIC | 0 | 0 | NA | 21 | 87 | -75.86% |
| Wellington | VIC | 0 | 5 | -100.00% | 4 | 24 | -83.33% |
| Wodonga – Alpine | VIC | 2 | 12 | -83.33% | 32 | 20 | 60.00% |
| Albury | NSW | 28 | 9 | 211.11% | 61 | 34 | 79.41% |
| Bathurst | NSW | 12 | 4 | 200.00% | 54 | 40 | 35.00% |
| Central Coast | NSW | 18 | 168 | -89.29% | 446 | 495 | -9.90% |
| Coffs Harbour | NSW | 0 | 8 | -100.00% | 246 | 128 | 92.19% |
| Dapto – Port Kembla | NSW | 6 | 33 | -81.82% | 313 | 192 | 63.02% |
| Dubbo | NSW | 1 | 8 | -87.50% | 61 | 80 | -23.75% |
| Gosford | NSW | 4 | 90 | -95.56% | 306 | 295 | 3.73% |
| Goulburn | NSW | 6 | 2 | 200.00% | 111 | 69 | 60.87% |
| Greater Sydney | NSW | 850 | 1983 | -57.14% | 19568 | 24260 | -19.34% |
| Griffith | NSW | 20 | 4 | 400.00% | 76 | 18 | 322.22% |
| Kiama – Shellharbour | NSW | 37 | 209 | -82.30% | 501 | 720 | -30.42% |
| Lake Macquarie | NSW | 34 | 37 | -8.11% | 474 | 369 | 28.46% |
| Lower Hunter | NSW | 22 | 24 | -8.33% | 125 | 135 | -7.41% |
| Maitland | NSW | 17 | 40 | -57.50% | 192 | 485 | -60.41% |
| New South Wales | NSW | 1349 | 2698 | -50.00% | 24327 | 29925 | -18.71% |
| Newcastle | NSW | 9 | 103 | -91.26% | 299 | 886 | -66.25% |
| Orange | NSW | 0 | 5 | -100.00% | 26 | 58 | -55.17% |
| Port Macquarie | NSW | 10 | 4 | 150.00% | 141 | 266 | -46.99% |
| Port Stephens | NSW | 6 | 4 | 50.00% | 139 | 287 | -51.57% |
| Rest of NSW | NSW | 499 | 715 | -30.21% | 4759 | 5665 | -15.99% |
| Richmond – Tweed | NSW | 25 | 10 | 150.00% | 283 | 328 | -13.72% |
| Shoalhaven | NSW | 17 | 10 | 70.00% | 231 | 231 | 0.00% |
| South Coast – Batemas Bay, Bega, Merimbula | NSW | 4 | 0 | Inf | 92 | 112 | -17.86% |
| Southern Highlands | NSW | 0 | 34 | -100.00% | 65 | 236 | -72.46% |
| Sydney – Baulkham Hills and Hawkesbury | NSW | 14 | 24 | -41.67% | 2049 | 1364 | 50.22% |
| Sydney – Blacktown | NSW | 14 | 431 | -96.75% | 2625 | 3724 | -29.51% |
| Sydney – City and Inner South | NSW | 91 | 129 | -29.46% | 1823 | 2909 | -37.33% |
| Sydney – Eastern Suburbs (Bondi, Coogee, Randwick) | NSW | 31 | 95 | -67.37% | 634 | 499 | 27.05% |
| Sydney – Inner South West | NSW | 144 | 140 | 2.86% | 2084 | 2247 | -7.25% |
| Sydney – Inner West (Canada Bay, Leichhardt, Strathfield) | NSW | 30 | 40 | -25.00% | 286 | 1235 | -76.84% |
| Sydney – North Sydney (Chatswood, Hornsby, Mosman) | NSW | 32 | 24 | 33.33% | 1403 | 962 | 45.84% |
| Sydney – Northern Beaches (Manly, Pittwater, Warringah) | NSW | 58 | 4 | 1350.00% | 310 | 466 | -33.48% |
| Sydney – Outer South West (Camden, Campbelltown, Wollondilly) | NSW | 47 | 37 | 27.03% | 520 | 709 | -26.66% |
| Sydney – Parramatta | NSW | 156 | 652 | -76.07% | 3369 | 4455 | -24.38% |
| Sydney – Penrith, Richmond, Blue Mountains | NSW | 8 | 21 | -61.90% | 721 | 594 | 21.38% |
| Sydney – Ryde | NSW | 48 | 54 | -11.11% | 849 | 2223 | -61.81% |
| Sydney – South West (Bringelly, Fairfield, Liverpool) | NSW | 88 | 124 | -29.03% | 1406 | 1227 | 14.59% |
| Sydney – Sutherland | NSW | 71 | 40 | 77.50% | 1043 | 1151 | -9.38% |
| Tamworth | NSW | 19 | 7 | 171.43% | 150 | 54 | 177.78% |
| Taree – Gloucester | NSW | 6 | 4 | 50.00% | 82 | 22 | 272.73% |
| Wagga Wagga | NSW | 4 | 0 | Inf | 118 | 42 | 180.95% |
| Wollongong | NSW | 24 | 133 | -81.95% | 314 | 533 | -41.09% |
| Wyong | NSW | 14 | 78 | -82.05% | 140 | 200 | -30.00% |
| Australian Capital Territory | ACT | 134 | 61 | 119.67% | 4605 | 3253 | 41.56% |