
For your information, below is a compilation of news and updates compiled from referenced sources.
HIA Building Approvals Data, August 2021
Globally, timber supply cannot meet demand
Unprecedented demand for framing timber is at record-high levels right across the world, including here in Australia. The boom of the global population’s demand for new detached homes and renovations of existing dwellings is due to a combination of factors which include:
- playing catch-up from the 2020 scale-back in supply and shipping
- the earlier lockdowns in 2020 which postponed home purchases
- record-low mortgage interest rates
- the availability of increased savings and global home building stimulus’
Home is where the heart is, now more than ever before.
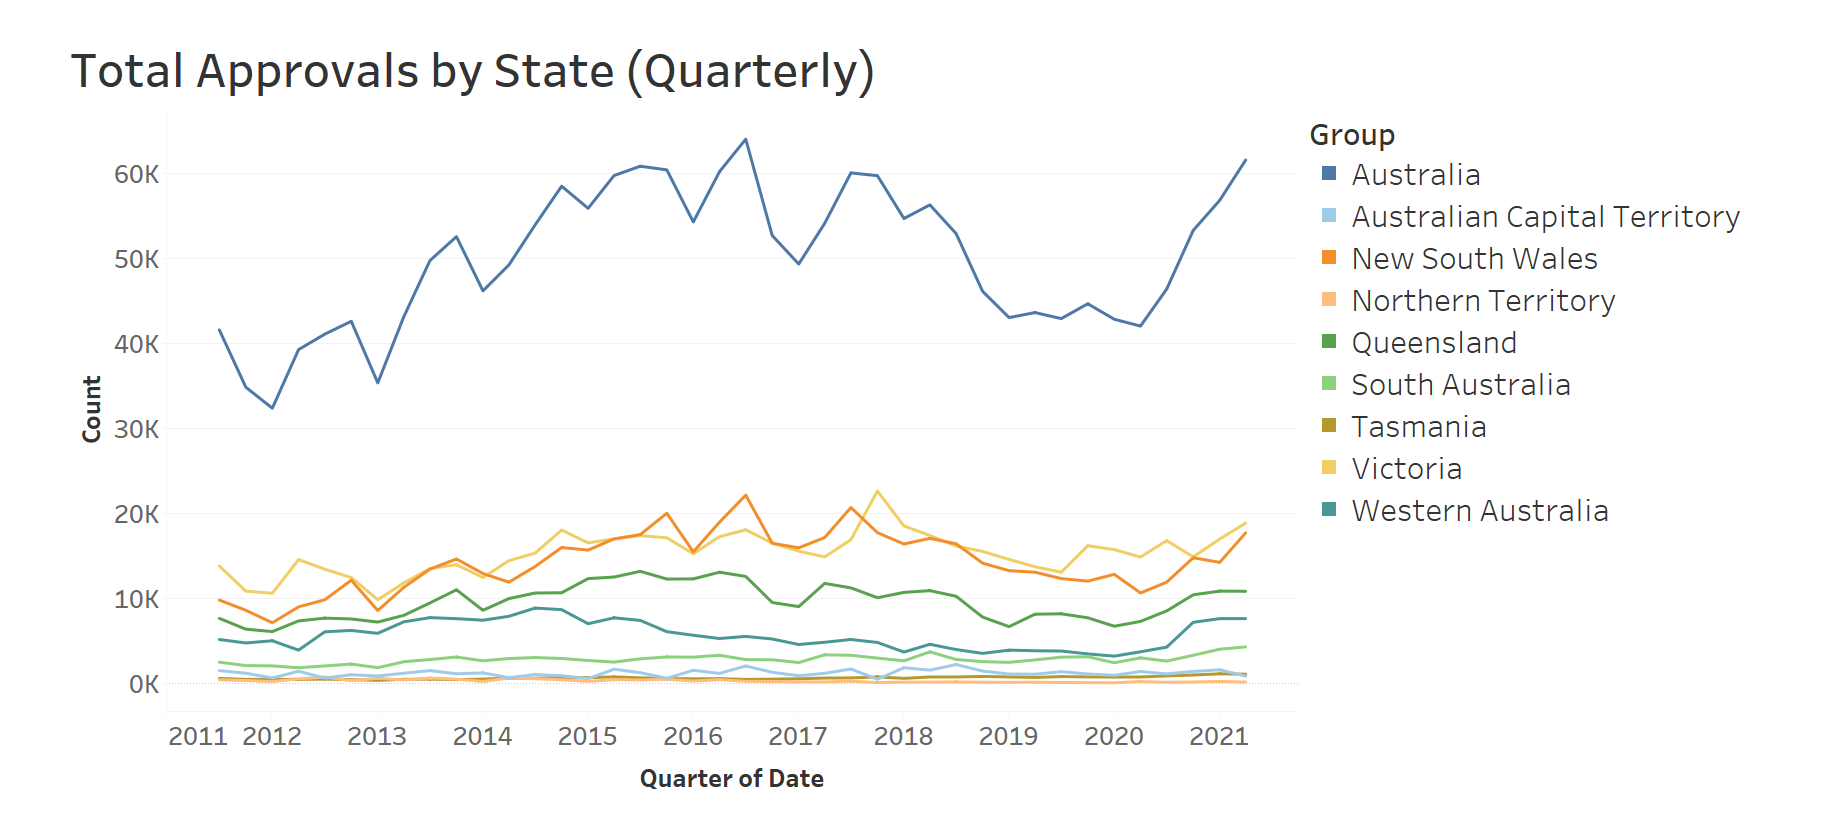
In Australia, the Federal Government expected 27,000 applications for new home starts under the HomeBuilder scheme. More than 121,000 applications were received. As a result, Australia-wide housing approvals are at record levels. According to HIA data, there was a 39% increase in total dwelling approvals from January to June 2021, compared to the same period last year, with the majority of that increase attributed to new houses.
Total Australian Dwelling Approvals, HIA August 2021
| Jan – June 2021 | Jan – June 2020 | Variance % | |
| Australia – Total Approvals | 118,544 | 84,987 | 39.48% |
| Australia – Single Detached Houses | 80,274 | 52,227 | 53.70% |
| Australian – Units or Townhouses | 38,270 | 32,760 | 16.82% |
The timber supply situation in Australia
Every Australian merchant continues to struggle to secure enough timber volume from both overseas and local producers and distributors.
- Local timber production does not meet local demand, even in usual conditions
- Last year’s bushfires and the significant losses to saw log supply have impacted local timber production capacity
- With the global demand for timber (lumber in American terms) at an all-time high, overseas based pine suppliers are choosing to send their products to the US or other markets where they can get the higher price, leaving Australia short
- The surged demand for timber has resulted in ongoing notifications of price increases which continue to be received from building supply manufacturers
- The demand-supply imbalance cannot be resolved easily
- No-one knows exactly when this huge spike in building work will drop. But, it will come with time
- FWPA, ABS, derived and Data Analyst Advisory Group IndustryEdge source shared this: “Our view is that the pipeline will take at least one year to build out, assuming everything goes back to normal on the demand side and the supply side continues to build flat out. In reality, with building industry lockdowns, supply chain disruptions and so on, we can expect the pipeline will take until at least the end of 2022 to be built out”
- As housing starts slow down, the pressure of the supply imbalance will decrease
- This pandemic has created the need for many businesses, across a broad range of industries, to prioritise limited supply to existing, loyal customers. Dahlsens too will continue to follow this strategy until such a time when supply is not challenged
- The long-standing relationships Dahlsens has built over time with suppliers aim to withstand the inherent cycles of the building industry, even this unprecedented time. It is true that these business partnerships have strengthened our supply position
- The key timber suppliers to Dahlsens, two of Australia’s largest framing timber producers, Timberlink and Hyne Timber, continue to honour priority supply, fast-tracking investments and innovations, working around the clock to further improve efficiencies, create access to additional resources and increase timber production to meet demand
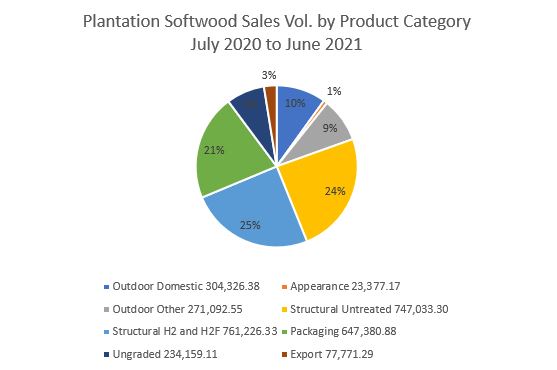
- Price increases, whilst debilitating, are limiting Australian softwood timber from being exported, which is protecting supply for local building. 2.5% of our softwood production is being exported, according to the Forest and Wood Products Australia, see graph below, of which is largely low-grade, non-structural product used to make products such as furniture and pallets.
- The pandemic has shone the spotlight on the value of local manufacturing, and we are an industry with a high level of Australian manufacturing. Dahlsens has strong supply relationships with the likes of Corinthian Doors, Rinnai, James Hardie, Laminex, Gyprock, Boral, and many more that manufacture right here on our shores, supporting local jobs and the Australian economy
Where to from here for builders regarding timber supply, a recommendation….
- Conservatively plan for delays as well as price increases in projects
- Provide suppliers with as much advance notice as possible of building supply needs
- Keep suppliers up to date with project requirements, as accurately as possible, so that customers jobs’ can be prioritised in order of requirements to site. Communication is more important than ever
- Plan for the time when there is a decrease in consumer demand for new housing
In the news: 50 containers of Aussie bound timber abandoned in China
Five hundred homes worth of timber destined for Melbourne has been abandoned at a Shanghai dock because a shipping company accepted a lucrative offer to divert course to Los Angeles. Source: The Age, The Hardware Journal.
The Master Builders Association of Victoria (MBAV) said 50 containers carrying timber had been dumped in China and warned the incident could worsen Australia’s timber shortage and lead to unfinished homes.
The shipment of European timber arrived in Shanghai in late July. The shipping company was then offered 60% more to use its shipping containers, according to the MBAV, prompting the ship to dump the timber at the Chinese port and leave for the US with new goods on board. It is unclear how the company was able to take this action, given it had a contract to deliver the goods to Australia.
Note, not one of Dahlsens’ suppliers, but another challenge for global supply.
Article from 18 August 2021 TimberBiz READ MORE
Report: HIA New Home Sales Current Update
- Demand for detached housing remains robust. Low interest rates and changes in consumer preference for location of housing have been the major drivers for activity following the end of HomeBuilder
- ABS Housing Finance data and Approvals data indicate that the bulk of projects initiated by HomeBuilder have cleared the final regulatory hurdles. There is now a record number of homes under construction across the country
- Despite national new home sales declining by 20.5 per cent in July compared to the previous month, with lockdowns in multiple states having restricted trading and eroded confidence, new home sales for the last three months remain 4.3 per cent higher than in the same period in 2018. This suggests a solid amount of building activity is still entering the pipeline, following the end of the HomeBuilder
Excerpt from the July edition of HIA New Home Sales Report (Monthly). READ MORE
In the news: Melbourne population falls 32,000, State’s housing boom rolls on
More than 32,000 Melburnians quit the city in the 12 months to March, the highest number to leave any Australian capital during this period of time.
Australian Bureau of Statistics figures to March show 18,000 of those left the state, the majority of these leaving for Queensland, South Australia and Western Australia.
The remaining 14,000 moved to regional Victoria.
Article from 3 August 2021 realestate.com.au. READ MORE
In the news: Queensland tops the housing scorecard
Queensland has been propelled to the top of HIA’s Housing Scorecard for the first time since 2007. The HIA Housing Scorecard report presents analysis which ranks each of the eight states and territories based on the performance of 13 key residential building indicators, including detached and multi-unit building activity, renovations, housing finance, and rates of overseas and interstate migration.
“With building activity booming across the economy it is difficult to pick just one jurisdiction that is outperforming the pack. Even in this strong market, Queensland has made the most of its opportunities,” HIA economist Tom Devitt said.
“Interstate migration has offset some of the loss of overseas migration in Queensland, unlike other east coast states.
“More than twice the number of interstate migrants are heading to Queensland than the average of the past decade. Other states have also seen a rise in interstate migration but none as strong as Queensland,” he said.
“The biggest mover has been Western Australia having jumped from the bottom of the table into fifth place in less than a year,” Mr Devitt said.
“The exodus of residents from Western Australia that has occurred for several years has been reversed and there are encouraging signs that the multi-unit market might also pick up.”
Article from 9 August 2021 TimberBiz READ MORE
In the news: What the 2032 Olympic Games means for Brisbane property market?
The Olympics should work as a positive influence on Brisbane housing market conditions, however, with the Games still some eleven years away, the flow on effects are likely to be gradual and centred around significant infrastructure upgrades and the associated medium-term uplift in jobs and longer-term improvements in transport efficiency.
The most significant positive influence on the housing market is likely to be seen in the years leading up to the Olympics, rather than during the four weeks of the Olympic and Paralympic games themselves.
Article from 22 July Core Logic READ MORE
In the news: Construction Industry A $360bn House of Cards
Australia’s construction industry is a $360-billion house of cards teetering in a profitless boom in which builders big and small are going bust—and warnings from its coalface indicate the worst is yet to come.
According to industry leaders, long-established cracks in the sector’s foundation are now so wide that it is “totally unsustainable” and in need of urgent major reform if it is to have the capacity to build projects that need to be built.
Up to 25 per cent of all insolvencies in Australia are companies within the construction industry.
“It’s a bit of a shocking statistic,” says Australian Constructors Association (ACA) chief executive Jon Davies. “Particularly when you look at it in terms of the industry’s contribution to the economy (8 to 10 per cent of GDP) it’s a disproportionately high level.
“At the moment you are hearing a lot of people talking about a ‘profitless boom’ and it has been a reality.”
“But the bigger issue is not so much the profit margins, it’s the willingness of our industry to accept risks that they really aren’t able to quantify, and they really shouldn’t be trying to, from clients that are more than happy to try to pass those risks onto them.”
Article from 2 July 2021 The Urban Developer READ MORE
In the news: Victoria introduces anti-wage theft laws that could see companies fined more than $1 million
Companies that deliberately underpay workers could face fines of more than $1 million under new wage theft laws coming into effect in Victoria [July 1 2021].
Individuals who deliberately underpay staff or dishonestly withhold wages could face up to 10 years’ jail, or fines over $200,000. For companies, the possible fine can be as high as $1,090,000.
Article from 1 July 2021 ABC News READ MORE
Dwelling Approvals Victoria and New South Wales, HIA August 2021
| Location | Greater Sydney | Greater Melbourne | ||||
| Dwelling Type | Total Dwelling | Single Detached House |
Unit/ Townhouse |
Total Dwelling | Single Detached House |
Unit/ Townhouse |
| Jul-20 | 3,184 | 1,406 | 1,778 | 4,304 | 2,593 | 1,711 |
| Aug-20 | 2,224 | 1,353 | 871 | 4,210 | 2,348 | 1,862 |
| Sep-20 | 2,444 | 1,445 | 999 | 4,639 | 2,491 | 2,148 |
| Oct-20 | 3,699 | 1,390 | 2,309 | 3,950 | 2,491 | 1,459 |
| Nov-20 | 3,789 | 1,372 | 2,417 | 3,478 | 2,319 | 1,159 |
| Dec-20 | 2,992 | 1,414 | 1,578 | 3,201 | 2,126 | 1,075 |
| Jan-21 | 2,654 | 998 | 1,656 | 2,454 | 1,682 | 772 |
| Feb-21 | 3,137 | 1,428 | 1,709 | 4,068 | 2,691 | 1,377 |
| Mar-21 | 4,117 | 1,580 | 2,537 | 5,601 | 3,227 | 2,374 |
| Apr-21 | 4,841 | 1,691 | 3,150 | 4,025 | 3,079 | 946 |
| May-21 | 4,566 | 1,955 | 2,611 | 4,336 | 2,896 | 1,440 |
| Jun-21 | 3,280 | 1,444 | 1,836 | 5,370 | 3,036 | 2,334 |
Even though Victoria has been experiencing a mass-exodus, the housing starts numbers for June continue to hover around their peak with 6950 new dwellings getting the green light. New South Wales on the other hand, saw a sharp decline in June, down from 6347 to 5003.
In the capitals, Sydney approvals have also dropped significantly in June down 39% from May 2021, while Melbourne rose 19.26%.
In the Victorian regional areas, the municipals leading the way for June 2021 vs June 2020 increases were Latrobe Valley (150%), Baw Baw (142%), Surf Coast + Bellarine Peninsula (140%) and South West Gippsland (96%).
In New South Wales the standouts were Wyong (up 64 houses from 0), Central Coast (327%), Dubbo (200%) and Taree – Gloucester (189%).
Overall for Australia, this is the third month in a row that total dwelling approvals have dropped.
“Since the unwinding of stimulus measures, approvals for private houses have fallen 20.9 per cent from the record high in April. Despite the fall, private house approvals remain at elevated levels and are 44.3 per cent higher than June 2020 and 37.6 per cent higher than June 2019,” said Daniel Rossi, ABS Director of Construction Statistics.
Housing Approvals data provided by HIA, August 2021
(scroll down the lists below to find all regions in Victoria and New South Wales)
Vic and NSW – Single Detached Houses Approvals
| Locations | State | June 2021 | June 2020 | % Difference | Rolling 12 Months |
Previous Rolling 12 Months |
% Difference |
| Victoria | VIC | 4511 | 3136 | 43.85% | 47742 | 36255 | 31.68% |
| Greater Melbourne | VIC | 3036 | 2145 | 41.54% | 30979 | 25305 | 22.42% |
| Ballarat | VIC | 136 | 118 | 15.25% | 1966 | 1169 | 68.18% |
| Baw Baw | VIC | 109 | 45 | 142.22% | 948 | 619 | 53.15% |
| Bendigo | VIC | 122 | 128 | -4.69% | 1606 | 1187 | 35.30% |
| Campaspe | VIC | 5 | 15 | -66.67% | 235 | 162 | 45.06% |
| Geelong | VIC | 259 | 194 | 33.51% | 2510 | 1646 | 52.49% |
| Gippsland – East | VIC | 55 | 35 | 57.14% | 533 | 326 | 63.50% |
| Gippsland – South West | VIC | 102 | 52 | 96.15% | 1145 | 688 | 66.42% |
| Grampians | VIC | 11 | 14 | -21.43% | 231 | 142 | 62.68% |
| Latrobe Valley | VIC | 65 | 26 | 150.00% | 606 | 296 | 104.73% |
| Melbourne – Inner East (Boroondara, Manningham, Whitehorse) | VIC | 55 | 63 | -12.70% | 664 | 682 | -2.64% |
| Melbourne – Inner South (Bayside, Glen Eira, Kingston, Stonnington – East) | VIC | 47 | 63 | -25.40% | 592 | 715 | -17.20% |
| Melbourne – Inner suburbs | VIC | 26 | 31 | -16.13% | 331 | 349 | -5.16% |
| Melbourne – North East (Banyule, Darebin – North, Kinglake, Whittlesea) | VIC | 438 | 278 | 57.55% | 4013 | 3275 | 22.53% |
| Melbourne – North West (Keilor, Macedon Ranges, Moreland – North, Sunbury, Tullamarine) | VIC | 372 | 279 | 33.33% | 4446 | 3655 | 21.64% |
| Melbourne – Outer East (Knox, Manningham, Maroondah, Whitehore – East, Yarra Ranges) | VIC | 75 | 82 | -8.54% | 1151 | 1048 | 9.83% |
| Melbourne – South East (Cardinia, Casey-North, Casey-South, Dandenong, Monash) | VIC | 603 | 526 | 14.64% | 6307 | 4952 | 27.36% |
| Melbourne – West (Brimbank, Hobsons Bay, Maribyrnong, Melton – Bacchus Marsh, Wyndham) | VIC | 1351 | 760 | 77.76% | 12558 | 9681 | 29.72% |
| Mildura | VIC | 27 | 15 | 80.00% | 390 | 230 | 69.57% |
| Mornington Peninsula – Frankston | VIC | 69 | 63 | 9.52% | 917 | 948 | -3.27% |
| Murray River – Swan Hill | VIC | 17 | 9 | 88.89% | 170 | 92 | 84.78% |
| Shepparton | VIC | 40 | 23 | 73.91% | 584 | 364 | 60.44% |
| Surf Coast – Bellarine Peninsula | VIC | 207 | 86 | 140.70% | 2035 | 1421 | 43.21% |
| Upper Goulburn Valley | VIC | 51 | 34 | 50.00% | 538 | 431 | 24.83% |
| Wangaratta – Benalla | VIC | 27 | 25 | 8.00% | 344 | 220 | 56.36% |
| Warrnambool | VIC | 30 | 24 | 25.00% | 428 | 289 | 48.10% |
| Wellington | VIC | 25 | 15 | 66.67% | 377 | 222 | 69.82% |
| Wodonga – Alpine | VIC | 72 | 55 | 30.91% | 834 | 489 | 70.55% |
| New South Wales | NSW | 2634 | 2074 | 27.00% | 30062 | 24193 | 24.26% |
| Greater Sydney | NSW | 1444 | 1223 | 18.07% | 17476 | 14422 | 21.18% |
| Albury | NSW | 44 | 33 | 33.33% | 652 | 412 | 58.25% |
| Bathurst | NSW | 23 | 21 | 9.52% | 323 | 239 | 35.15% |
| Central Coast | NSW | 94 | 22 | 327.27% | 981 | 675 | 45.33% |
| Coffs Harbour | NSW | 29 | 20 | 45.00% | 384 | 269 | 42.75% |
| Dapto – Port Kembla | NSW | 28 | 24 | 16.67% | 427 | 316 | 35.13% |
| Dubbo | NSW | 33 | 11 | 200.00% | 396 | 191 | 107.33% |
| Gosford | NSW | 30 | 22 | 36.36% | 311 | 320 | -2.81% |
| Goulburn | NSW | 37 | 17 | 117.65% | 273 | 148 | 84.46% |
| Griffith | NSW | 7 | 5 | 40.00% | 132 | 109 | 21.10% |
| Kiama – Shellharbour | NSW | 55 | 31 | 77.42% | 558 | 383 | 45.69% |
| Lake Macquarie | NSW | 126 | 85 | 48.24% | 938 | 790 | 18.73% |
| Lower Hunter | NSW | 104 | 60 | 73.33% | 917 | 621 | 47.67% |
| Maitland | NSW | 81 | 71 | 14.08% | 870 | 994 | -12.47% |
| Newcastle | NSW | 25 | 42 | -40.48% | 354 | 355 | -0.28% |
| Orange | NSW | 35 | 25 | 40.00% | 260 | 239 | 8.79% |
| Port Macquarie | NSW | 49 | 31 | 58.06% | 402 | 361 | 11.36% |
| Port Stephens | NSW | 27 | 19 | 42.11% | 267 | 187 | 42.78% |
| Rest of NSW | NSW | 1190 | 851 | 39.84% | 12586 | 9771 | 28.81% |
| Richmond – Tweed | NSW | 90 | 73 | 23.29% | 910 | 831 | 9.51% |
| Shoalhaven | NSW | 41 | 55 | -25.45% | 620 | 465 | 33.33% |
| South Coast – Batemas Bay, Bega, Merimbula | NSW | 32 | 36 | -11.11% | 431 | 337 | 27.89% |
| Southern Highlands | NSW | 17 | 6 | 183.33% | 211 | 216 | -2.31% |
| Sutherland | NSW | 34 | 17 | 100.00% | 314 | 187 | 67.91% |
| Sydney – Baulkham Hills and Hawkesbury | NSW | 100 | 141 | -29.08% | 2148 | 1787 | 20.20% |
| Sydney – Blacktown | NSW | 352 | 294 | 19.73% | 3455 | 2840 | 21.65% |
| Sydney – City and Inner South | NSW | 15 | 8 | 87.50% | 121 | 86 | 40.70% |
| Sydney – Eastern Suburbs (Bondi, Coogee, Randwick) | NSW | 11 | 16 | -31.25% | 124 | 179 | -30.73% |
| Sydney – Inner South West (Bankstown, Cantebury, Hurtsville) | NSW | 96 | 68 | 41.18% | 1017 | 1007 | 0.99% |
| Sydney – Inner West (Canada Bay, Leichhardt, Strathfield) | NSW | 29 | 20 | 45.00% | 294 | 227 | 29.52% |
| Sydney – North Sydney (Chatswood, Hornsby, Mosman) | NSW | 58 | 44 | 31.82% | 502 | 489 | 2.66% |
| Sydney – Northern Beaches (Manly, Pittwater, Warringah) | NSW | 26 | 26 | 0.00% | 435 | 351 | 23.93% |
| Sydney – Outer South West (Camden, Campbelltown, Wollondilly) | NSW | 142 | 180 | -21.11% | 2120 | 1812 | 17.00% |
| Sydney – Parramatta | NSW | 67 | 63 | 6.35% | 875 | 722 | 21.19% |
| Sydney – Penrith, Richmond, Blue Mountains | NSW | 78 | 99 | -21.21% | 1028 | 984 | 4.47% |
| Sydney – Ryde | NSW | 32 | 17 | 88.24% | 240 | 201 | 19.40% |
| Sydney – South West (Bringelly, Fairfield, Liverpool) | NSW | 310 | 208 | 49.04% | 3822 | 2875 | 32.94% |
| Tamworth | NSW | 31 | 12 | 158.33% | 304 | 180 | 68.89% |
| Taree – Gloucester | NSW | 55 | 19 | 189.47% | 317 | 209 | 51.67% |
| Wagga Wagga | NSW | 42 | 20 | 110.00% | 533 | 382 | 39.53% |
| Wollongong | NSW | 18 | 31 | -41.94% | 239 | 215 | 11.16% |
| Wyong | NSW | 64 | 0 | 670 | 355 | 88.73% | |
| Australian Capital Territory | ACT | 125 | 90 | 38.89% | 1491 | 1233 | 20.92% |
Vic and NSW – Units and Apartment Approvals
| Locations | State | June 2021 | June 2020 | % Difference | Rolling 12 Months |
Previous Rolling 12 Months |
% Difference |
| Victoria | VIC | 2439 | 1492 | 63.47% | 19926 | 23760 | -16.14% |
| Greater Melbourne | VIC | 2334 | 1403 | 66.36% | 18657 | 22824 | -18.26% |
| Ballarat | VIC | 6 | 4 | 50.00% | 188 | 79 | 137.97% |
| Baw Baw | VIC | 2 | 0 | 48 | 27 | 77.78% | |
| Bendigo | VIC | 2 | 4 | -50.00% | 23 | 73 | -68.49% |
| Campaspe | VIC | 0 | 0 | 8 | 5 | 60.00% | |
| Geelong | VIC | 44 | 17 | 158.82% | 355 | 339 | 4.72% |
| Gippsland – East | VIC | 0 | 0 | 8 | 0 | ||
| Gippsland – South West | VIC | 0 | 7 | -100.00% | 38 | 34 | 11.76% |
| Grampians | VIC | 2 | 2 | 0.00% | 26 | 7 | 271.43% |
| Latrobe Valley | VIC | 0 | 35 | -100.00% | 20 | 50 | -60.00% |
| Melbourne – Inner East (Boroondara, Manningham, Whitehorse) | VIC | 290 | 106 | 173.58% | 2414 | 2659 | -9.21% |
| Melbourne – Inner South (Bayside, Glen Eira, Kingston, Stonnington – East) | VIC | 287 | 129 | 122.48% | 2820 | 1702 | 65.69% |
| Melbourne – Inner suburbs | VIC | 340 | 557 | -38.96% | 4258 | 9075 | -53.08% |
| Melbourne – North East (Banyule, Darebin – North, Kinglake, Whittlesea) | VIC | 234 | 164 | 42.68% | 1666 | 1912 | -12.87% |
| Melbourne – North West (Keilor, Macedon Ranges, Moreland – North, Sunbury, Tullamarine) | VIC | 93 | 91 | 2.20% | 979 | 1228 | -20.28% |
| Melbourne – Outer East (Knox, Manningham, Maroondah, Whitehore – East, Yarra Ranges) | VIC | 138 | 93 | 48.39% | 1153 | 1327 | -13.11% |
| Melbourne – South East (Cardinia, Casey-North, Casey-South, Dandenong, Monash) | VIC | 223 | 120 | 85.83% | 1813 | 1950 | -7.03% |
| Melbourne – West (Brimbank, Hobsons Bay, Maribyrnong, Melton – Bacchus Marsh, Wyndham) | VIC | 655 | 121 | 441.32% | 3070 | 2418 | 26.96% |
| Mildura | VIC | 0 | 4 | -100.00% | 25 | 12 | 108.33% |
| Mornington Peninsula – Frankston | VIC | 74 | 22 | 236.36% | 484 | 553 | -12.48% |
| Murray River – Swan Hill | VIC | 0 | 0 | 13 | 9 | 44.44% | |
| Shepparton | VIC | 0 | 0 | 38 | 16 | 137.50% | |
| Surf Coast – Bellarine Peninsula | VIC | 8 | 16 | -50.00% | 219 | 204 | 7.35% |
| Upper Goulburn Valley | VIC | 4 | 0 | 23 | 24 | -4.17% | |
| Wangaratta – Benalla | VIC | 10 | 0 | 50 | 4 | 1150.00% | |
| Warrnambool | VIC | 2 | 0 | 95 | 10 | 850.00% | |
| Wellington | VIC | 8 | 0 | 19 | 7 | 171.43% | |
| Wodonga – Alpine | VIC | 0 | 0 | 8 | 4 | 100.00% | |
| New South Wales | NSW | 2369 | 1160 | 104.22% | 28706 | 23757 | 20.83% |
| Greater Sydney | NSW | 1836 | 924 | 98.70% | 23451 | 18974 | 23.60% |
| Albury | NSW | 0 | 2 | -100.00% | 27 | 47 | -42.55% |
| Bathurst | NSW | 4 | 2 | 100.00% | 44 | 84 | -47.62% |
| Central Coast | NSW | 21 | 19 | 10.53% | 344 | 446 | -22.87% |
| Coffs Harbour | NSW | 21 | 0 | 107 | 70 | 52.86% | |
| Dapto – Port Kembla | NSW | 6 | 6 | 0.00% | 168 | 190 | -11.58% |
| Dubbo | NSW | 18 | 8 | 125.00% | 76 | 73 | 4.11% |
| Gosford | NSW | 4 | 19 | -78.95% | 214 | 273 | -21.61% |
| Goulburn | NSW | 5 | 12 | -58.33% | 72 | 91 | -20.88% |
| Griffith | NSW | 0 | 2 | -100.00% | 16 | 12 | 33.33% |
| Kiama – Shellharbour | NSW | 31 | 28 | 10.71% | 540 | 454 | 18.94% |
| Lake Macquarie | NSW | 82 | 12 | 583.33% | 360 | 453 | -20.53% |
| Lower Hunter | NSW | 20 | 8 | 150.00% | 120 | 46 | 160.87% |
| Maitland | NSW | 11 | 28 | -60.71% | 399 | 251 | 58.96% |
| Newcastle | NSW | 166 | 32 | 418.75% | 810 | 1260 | -35.71% |
| Orange | NSW | 9 | 4 | 125.00% | 83 | 35 | 137.14% |
| Port Macquarie | NSW | 13 | 12 | 8.33% | 266 | 142 | 87.32% |
| Port Stephens | NSW | 4 | 0 | 319 | 36 | 786.11% | |
| Rest of NSW | NSW | 533 | 236 | 125.85% | 5255 | 4783 | 9.87% |
| Richmond – Tweed | NSW | 40 | 43 | -6.98% | 351 | 328 | 7.01% |
| Shoalhaven | NSW | 3 | 8 | -62.50% | 245 | 305 | -19.67% |
| South Coast – Batemas Bay, Bega, Merimbula | NSW | 8 | 4 | 100.00% | 115 | 39 | 194.87% |
| Southern Highlands | NSW | 43 | 0 | 197 | 22 | 795.45% | |
| Sutherland | NSW | 93 | 25 | 272.00% | 1163 | 918 | 26.69% |
| Sydney – Baulkham Hills and Hawkesbury | NSW | 20 | 6 | 233.33% | 1401 | 431 | 225.06% |
| Sydney – Blacktown | NSW | 367 | 20 | 1735.00% | 3155 | 1563 | 101.86% |
| Sydney – City and Inner South | NSW | 29 | 2 | 1350.00% | 2778 | 1382 | 101.01% |
| Sydney – Eastern Suburbs (Bondi, Coogee, Randwick) | NSW | 26 | 12 | 116.67% | 433 | 463 | -6.48% |
| Sydney – Inner South West (Bankstown, Cantebury, Hurtsville) | NSW | 318 | 170 | 87.06% | 2309 | 3306 | -30.16% |
| Sydney – Inner West (Canada Bay, Leichhardt, Strathfield) | NSW | 397 | 80 | 396.25% | 1328 | 1080 | 22.96% |
| Sydney – North Sydney (Chatswood, Hornsby, Mosman) | NSW | 123 | 22 | 459.09% | 1113 | 910 | 22.31% |
| Sydney – Northern Beaches (Manly, Pittwater, Warringah) | NSW | 168 | 82 | 104.88% | 458 | 206 | 122.33% |
| Sydney – Outer South West (Camden, Campbelltown, Wollondilly) | NSW | 40 | 19 | 110.53% | 706 | 856 | -17.52% |
| Sydney – Parramatta | NSW | 92 | 247 | -62.75% | 4408 | 3861 | 14.17% |
| Sydney – Penrith, Richmond, Blue Mountains | NSW | 8 | 29 | -72.41% | 663 | 626 | 5.91% |
| Sydney – Ryde | NSW | 105 | 8 | 1212.50% | 1892 | 1515 | 24.88% |
| Sydney – South West (Bringelly, Fairfield, Liverpool) | NSW | 29 | 183 | -84.15% | 1300 | 1411 | -7.87% |
| Tamworth | NSW | 6 | 10 | -40.00% | 51 | 69 | -26.09% |
| Taree – Gloucester | NSW | 2 | 2 | 0.00% | 18 | 70 | -74.29% |
| Wagga Wagga | NSW | 2 | 0 | 51 | 34 | 50.00% | |
| Wollongong | NSW | 10 | 7 | 42.86% | 488 | 481 | 1.46% |
| Wyong | NSW | 17 | 0 | 130 | 173 | -24.86% | |
| Australian Capital Territory | ACT | 200 | 293 | -31.74% | 3584 | 3689 | -2.85% |