
2021 has thrown opportunity with challenge for our industry; booming demand for housing, Covid-19 lockdowns and restrictions, supply shortages, labour shortages and price increases to name a few. It’s been a big year, that’s for sure!
It looks like demand for housing in 2022 will be much the same as this year.
According to HIA Chief Economist, Tim Reardon, demand for new detached and multi-unit housing has remained strong, suggesting that the current boom in home building will be sustained throughout 2022.
“There has been a clear shift towards lower density housing during the pandemic and this trend does not appear to show signs of slowing. This shift is not just those in units moving to detached housing but includes a shift to fewer people per household. As a result, we have seen a significant change in the volume, type and location of new homes. These trends are similar in other countries,” said Tim.
“Sales since the end of HomeBuilder (April 2021 – October 2021) are the strongest they have been since 2017 when over 115,000 detached homes commenced construction.
This strong level of home building activity suggests that the current boom in residential construction will be sustained throughout 2022. The full impact of the loss of migration is yet to fully impact demand for detached housing and a rise in interest rates will mark the end of this COVID building boom. The industry will continue to run at capacity throughout 2022, constrained by the availability of land, labour and materials. Over the year to September, the price of skilled trades increased by 5.2 per cent, while the price of materials as measured by the ABS increased by 8.0 per cent. The price of residential land increased by 8.5 per cent in the 2020/21 financial year. This has led to an increase in the cost of a new house and land package,” said Tim.
For your information, below is a compilation of news and updates compiled from referenced sources.
Scroll down for HIA Building Approvals Data, October 2021
INDUSTRY NEWS IN REVIEW
In the news: Dark roofs to be banned in NSW, planning minister says
The NSW government will move to ban dark roofs as part of its push to deliver more sustainable housing and reach its target of net zero emissions by 2050.
Speaking to the Committee for Sydney, planning minister Rob Stokes foreshadowed the policy switch to ensure all new housing has light-coloured roofing.
He said recent University of NSW research commissioned by the federal government found Sydney’s ambient temperatures could be reduced by up to 2.4C if dark roofing was ditched across the city. A light coloured roof could reduce temperatures inside the home by up to 10 degrees during a heatwave.
Article from 17th November 2021 The Guardian READ MORE
In the news: Victorian building boom slows, but fears for Melbourne CBD left behind
Victoria’s record-setting building boom appears to finally be slowing, with the number of new houses approved for construction falling to its lowest level since August last year.
But it’s only a tapering, with demand still high enough to drive Melbourne’s median land price to an almost $335,000 record across the three months to September, and with enough work in the pipeline already to have builders booked to the second half of 2022.
The boom has been big enough to cause shortages of numerous building supplies, most notably wooden frames. There’s also been a rise in thefts from building sites.
Article from 4th November 2021 Realestate.com.au READ MORE
Report: Building a New Home: Construction Cost Changes
This article investigates the changes in construction cost between the value of approval, the expected value at commencement and the final value at completion of construction for new houses, townhouses and apartments. These values exclude the value of land and landscaping but include site preparation costs associated with building activity.
Key Statistics
- Almost half of new residential dwellings (44.9% of dwellings) cost more to build than they were approved for, while 22.5% of dwellings cost less.
- Overall, new residential dwellings cost 1.4% more to build than they were approved for, with an average increase of $3,941 per dwelling.
- Apartments had the largest changes in the cost of construction, rising by 6.3% between approval and commencement and falling by 8.1% between commencement and completion.
- Houses had the smallest cost changes, rising by 2.3% from approval to commencement and falling by 0.4% from commencement to completion.
Article from 14th October 2021 Australian Bureau of Statistics READ MORE
In the news: These households are ditching gas, slashing bills and going ‘net zero’. Here’s how
After receiving a $400 gas bill in their first month, they began a process of improving insulation, swapping out gas appliances for electrical ones, and generally making the house “net zero” in terms of energy use, meaning it produces as much energy as it consumes over a period of time.
It looks unassuming from the outside, but this Brunswick East house is “net zero”.
They now have no gas bills and, over the course of a year, export more electricity to the grid than they import.
All up, the transition cost them $12,000.
And within just a few years, they’re likely to make that money back.
Article from October 2021 ABC READ MORE
Report: Surfing the Housing Pipeline (or, measuring the demand-supply gap)
FTMA Housing Report, prepared by Tim Woods, Industry Edge, Sept 2021. Considerations to share: In July, Australia’s total monthly dwelling approvals fell for the fourth successive month, but at 18,651 dwellings, approvals were still up a whopping 19.3% compared with July 2020 and more than 29% higher than in July 2019. – It looks like approvals will peak year ended August at about 225,000 dwellings. -The record for annual approvals was the year-ended August 2016, when they hit 240,624. We will not reach that level this boom. – “we cannot yet forecast future wood demand”
Article from September 2021 Frame and Truss Manufacturing Association of Australia READ MORE
In the news: Queensland shakes off COVID to have the strongest construction market
Queensland continues to have the strongest residential market in the country as the state avoided lengthy lockdowns that occurred along the rest of the east coast.
The HIA Housing Scorecard report presents analysis which ranks each of the eight states and territories based on the performance of 13 key residential building indicators against their decade average covering, detached and multi-unit building activity, renovations, housing finance, and rates of overseas and interstate migration.
“Demand for new detached and multi-unit construction has remained strong even with lockdowns. It appears that the more time people spend in lockdown, the higher demand is for detached housing and renovations activity. As a result, building activity is booming in every market. Queensland has continued to capitalise on these shifting trends and its low COVID infections to have the strongest residential construction market in the country,” added Ms Lillicrap.
Article from December 2021 HIA READ MORE
In the news: Investor activity in housing increases
The value of loans to investors continued to increase in October to reach its highest level since April 2015.
The ABS released the Lending to Households and Businesses data for October 2021 today. The publication presents statistics on housing finance commitments including for the purchase or construction of new dwellings.
“Despite this near record level of investor activity, they accounted for a relatively modest 33 per cent of the total lending in October. This is well below their peak of activity in the market in 2015 when they reached 46 per cent of the value of lending,” added Mr Devitt.
Article from December 2021 HIA READ MORE
In the news: Women on construction sites welcome NSW funding boost to increase numbers
A $57.4 million state government funding boost is aimed at transitioning more workers into construction, and one part will be to put tools in young women’s hands.
The four-year program will partner with 139 high schools to give girls real life experience.
NSW Skills and Tertiary Education Minister, Geoff Lee said the low number of female tradies needed to change.
“It is bloody hard as a single female to be surrounded by a male dominated workforce. Women need support just like other employees and that’s the approach we are targeting,” Mr Lee said.
Article from December 2021 ABC READ MORE
In the news: New incentives for Victorian build-to-rent construction
The Victorian Government will provide new incentives for investors to build rental properties to help ensure more people have safe, secure housing.
Eligible build‑to‑rent developments completed and operational between 1 January 2021 and 31 December 2031 will receive both the 50 per cent land tax discount and full exemption from the Absentee Owner Surcharge (AOS) for up to 30 years from 1 January 2022.
Originally announced to end in 2040, this support will now provide the certainty of a full 30-year concession to projects starting before 2032.
Article from October 2021 Inside Construction READ MORE
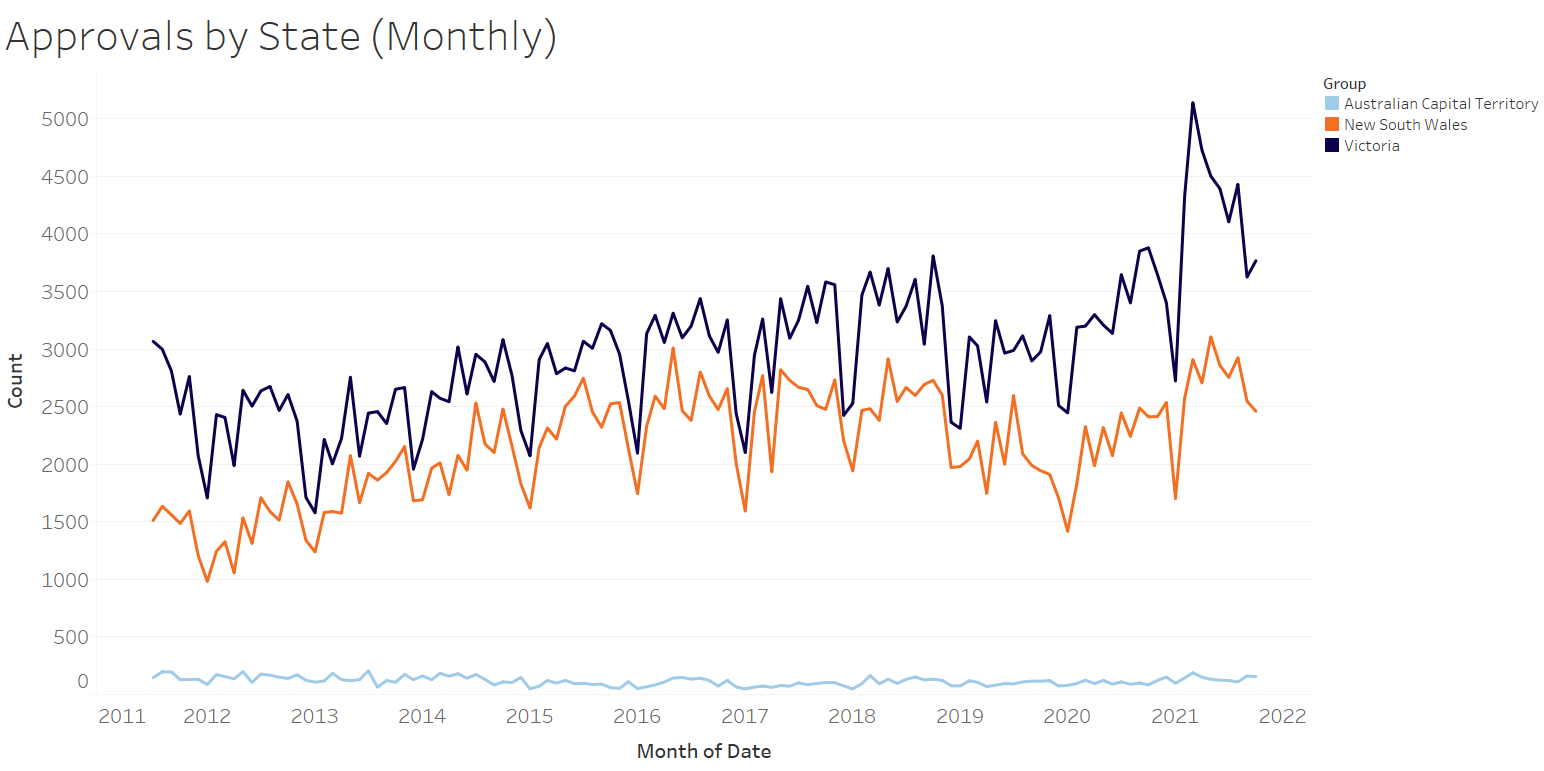
STATE & REGIONAL HOUSING APPROVALS
Housing Approvals data provided by HIA, October 2021
(scroll down the lists below to find all regions in Victoria and New South Wales)
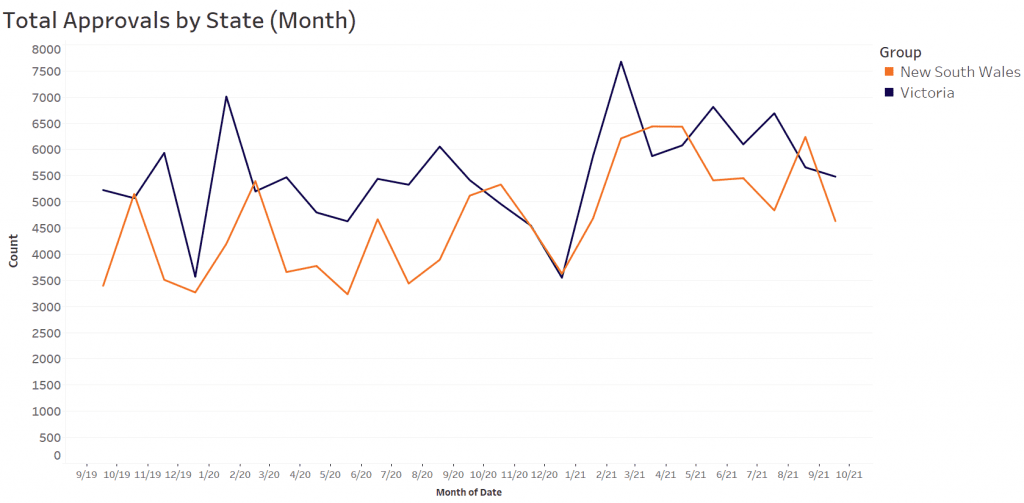
Dwelling Approvals
Victoria and New South Wales, HIA October 2021
| New South Wales | Victoria | |||||
| Date | Total Dwelling | Single Detached House |
Unit/ Townhouse |
Total Dwelling | Single Detached House |
Unit/ Townhouse |
| Nov-20 | 5331 | 2414 | 2917 | 4958 | 3646 | 1312 |
| Dec-20 | 4532 | 2537 | 1995 | 4546 | 3403 | 1143 |
| Jan-21 | 3627 | 1702 | 1925 | 3550 | 2723 | 827 |
| Feb-21 | 4681 | 2573 | 2108 | 5870 | 4322 | 1548 |
| Mar-21 | 6211 | 2909 | 3302 | 7678 | 5140 | 2538 |
| Apr-21 | 6440 | 2706 | 3734 | 5874 | 4727 | 1147 |
| May-21 | 6436 | 3106 | 3330 | 6077 | 4502 | 1575 |
| Jun-21 | 5410 | 2858 | 2552 | 6813 | 4393 | 2420 |
| Jul-21 | 5452 | 2754 | 2698 | 6098 | 4105 | 1993 |
| Aug-21 | 4837 | 2925 | 1912 | 6691 | 4431 | 2260 |
| Sep-21 | 6240 | 2547 | 3693 | 5659 | 3626 | 2033 |
| Oct-21 | 4632 | 2460 | 2172 | 5481 | 3767 | 1714 |
Vic and NSW – Single Detached Houses Approvals
| Locations | State | Oct-21 | Oct-20 | %
Difference |
Rolling 12 Months | Previous Rolling 12 Months | 12 Month Variance |
| Victoria | VIC | 3767 | 3880 | -2.91% | 48785 | 39058 | 24.90% |
| Greater Melbourne | VIC | 2684 | 2491 | 7.75% | 31946 | 26762 | 19.37% |
| Ballarat | VIC | 157 | 146 | 7.53% | 1955 | 1426 | 37.10% |
| Baw Baw | VIC | 52 | 57 | -8.77% | 994 | 620 | 60.32% |
| Bendigo | VIC | 105 | 135 | -22.22% | 1616 | 1271 | 27.14% |
| Campaspe | VIC | 6 | 12 | -50.00% | 205 | 190 | 7.89% |
| Geelong | VIC | 145 | 210 | -30.95% | 2537 | 1872 | 35.52% |
| Gippsland – East | VIC | 43 | 40 | 7.50% | 553 | 370 | 49.46% |
| Gippsland – South West | VIC | 73 | 82 | -10.98% | 1184 | 796 | 48.74% |
| Grampians | VIC | 19 | 26 | -26.92% | 224 | 170 | 31.76% |
| Latrobe Valley | VIC | 40 | 86 | -53.49% | 555 | 379 | 46.44% |
| Melbourne – Inner East (Boroondara, Manningham, Whitehorse) | VIC | 56 | 73 | -23.29% | 700 | 656 | 6.71% |
| Melbourne – Inner South (Bayside, Glen Eira, Kingston, Stonnington – East) | VIC | 55 | 44 | 25.00% | 600 | 652 | -7.98% |
| Melbourne – Inner suburbs | VIC | 37 | 29 | 27.59% | 366 | 341 | 7.33% |
| Melbourne – North East (Banyule, Darebin – North, Kinglake, Whittlesea) | VIC | 297 | 304 | -2.30% | 4157 | 3333 | 24.72% |
| Melbourne – North West (Keilor, Macedon Ranges, Moreland – North, Sunbury, Tullamarine) | VIC | 467 | 385 | 21.30% | 4351 | 4013 | 8.42% |
| Melbourne – Outer East (Knox, Manningham, Maroondah, Whitehore – East, Yarra Ranges) | VIC | 96 | 101 | -4.95% | 1157 | 1050 | 10.19% |
| Melbourne – South East (Cardinia, Casey-North, Casey-South, Dandenong, Monash) | VIC | 542 | 494 | 9.72% | 6714 | 5208 | 28.92% |
| Melbourne – West (Brimbank, Hobsons Bay, Maribyrnong, Melton – Bacchus Marsh, Wyndham) | VIC | 1048 | 965 | 8.60% | 12967 | 10581 | 22.55% |
| Mildura | VIC | 18 | 39 | -53.85% | 373 | 258 | 44.57% |
| Mornington Peninsula – Frankston | VIC | 86 | 96 | -10.42% | 934 | 928 | 0.65% |
| Murray River – Swan Hill | VIC | 9 | 16 | -43.75% | 166 | 113 | 46.90% |
| Shepparton | VIC | 41 | 44 | -6.82% | 608 | 410 | 48.29% |
| Surf Coast – Bellarine Peninsula | VIC | 150 | 176 | -14.77% | 2018 | 1592 | 26.76% |
| Upper Goulburn Valley | VIC | 37 | 41 | -9.76% | 613 | 383 | 60.05% |
| Wangaratta – Benalla | VIC | 22 | 31 | -29.03% | 356 | 270 | 31.85% |
| Warrnambool | VIC | 19 | 27 | -29.63% | 402 | 330 | 21.82% |
| Wellington | VIC | 18 | 30 | -40.00% | 390 | 233 | 67.38% |
| Wodonga – Alpine | VIC | 45 | 73 | -38.36% | 787 | 591 | 33.16% |
| New South Wales | NSW | 2460 | 2412 | 1.99% | 31491 | 25160 | 25.16% |
| Greater Sydney | NSW | 1348 | 1401 | -3.78% | 18135 | 15103 | 20.08% |
| Albury | NSW | 47 | 44 | 6.82% | 653 | 435 | 50.11% |
| Bathurst | NSW | 18 | 28 | -35.71% | 332 | 226 | 46.90% |
| Central Coast | NSW | 91 | 87 | 4.60% | 1064 | 763 | 39.45% |
| Coffs Harbour | NSW | 28 | 36 | -22.22% | 390 | 265 | 47.17% |
| Dapto – Port Kembla | NSW | 23 | 37 | -37.84% | 401 | 339 | 18.29% |
| Dubbo | NSW | 15 | 21 | -28.57% | 389 | 229 | 69.87% |
| Gosford | NSW | 27 | 22 | 22.73% | 347 | 289 | 20.07% |
| Goulburn | NSW | 29 | 13 | 123.08% | 358 | 159 | 125.16% |
| Griffith | NSW | 25 | 10 | 150.00% | 175 | 90 | 94.44% |
| Kiama – Shellharbour | NSW | 34 | 66 | -48.48% | 528 | 450 | 17.33% |
| Lake Macquarie | NSW | 97 | 98 | -1.02% | 1070 | 878 | 21.87% |
| Lower Hunter | NSW | 63 | 50 | 26.00% | 908 | 670 | 35.52% |
| Maitland | NSW | 103 | 59 | 74.58% | 825 | 910 | -9.34% |
| Newcastle | NSW | 8 | 36 | -77.78% | 302 | 330 | -8.48% |
| Orange | NSW | 28 | 15 | 86.67% | 276 | 253 | 9.09% |
| Port Macquarie | NSW | 36 | 20 | 80.00% | 491 | 363 | 35.26% |
| Port Stephens | NSW | 24 | 23 | 4.35% | 308 | 180 | 71.11% |
| Rest of NSW | NSW | 1112 | 1011 | 9.99% | 13356 | 10057 | 32.80% |
| Richmond – Tweed | NSW | 70 | 73 | -4.11% | 1052 | 762 | 38.06% |
| Shoalhaven | NSW | 68 | 53 | 28.30% | 677 | 495 | 36.77% |
| South Coast – Batemas Bay, Bega, Merimbula | NSW | 29 | 39 | -25.64% | 420 | 370 | 13.51% |
| Southern Highlands | NSW | 26 | 25 | 4.00% | 219 | 226 | -3.10% |
| Sutherland | NSW | 23 | 21 | 9.52% | 346 | 209 | 65.55% |
| Sydney – Baulkham Hills and Hawkesbury | NSW | 104 | 189 | -44.97% | 2226 | 1747 | 27.42% |
| Sydney – Blacktown | NSW | 245 | 280 | -12.50% | 3554 | 2964 | 19.91% |
| Sydney – City and Inner South | NSW | 10 | 16 | -37.50% | 103 | 91 | 13.19% |
| Sydney – Eastern Suburbs (Bondi, Coogee, Randwick) | NSW | 7 | 11 | -36.36% | 132 | 137 | -3.65% |
| Sydney – Inner South West (Bankstown, Cantebury, Hurtsville) | NSW | 69 | 82 | -15.85% | 1000 | 998 | 0.20% |
| Sydney – Inner West (Canada Bay, Leichhardt, Strathfield) | NSW | 25 | 19 | 31.58% | 296 | 245 | 20.82% |
| Sydney – North Sydney (Chatswood, Hornsby, Mosman) | NSW | 40 | 37 | 8.11% | 521 | 463 | 12.53% |
| Sydney – Northern Beaches (Manly, Pittwater, Warringah) | NSW | 39 | 26 | 50.00% | 478 | 360 | 32.78% |
| Sydney – Outer South West (Camden, Campbelltown, Wollondilly) | NSW | 102 | 187 | -45.45% | 1791 | 2030 | -11.77% |
| Sydney – Parramatta | NSW | 83 | 57 | 45.61% | 854 | 720 | 18.61% |
| Sydney – Penrith, Richmond, Blue Mountains | NSW | 81 | 98 | -17.35% | 1073 | 1027 | 4.48% |
| Sydney – Ryde | NSW | 42 | 24 | 75.00% | 363 | 248 | 46.37% |
| Sydney – South West (Bringelly, Fairfield, Liverpool) | NSW | 387 | 267 | 44.94% | 4334 | 3101 | 39.76% |
| Tamworth | NSW | 20 | 35 | -42.86% | 331 | 184 | 79.89% |
| Taree – Gloucester | NSW | 29 | 13 | 123.08% | 361 | 218 | 65.60% |
| Wagga Wagga | NSW | 50 | 51 | -1.96% | 578 | 407 | 42.01% |
| Wollongong | NSW | 25 | 20 | 25.00% | 258 | 227 | 13.66% |
| Wyong | NSW | 64 | 65 | -1.54% | 717 | 474 | 51.27% |
| Australian Capital Territory | ACT | 156 | 83 | 87.95% | 1657 | 1181 | 40.30% |
Vic and NSW – Units and Apartment Approvals
| Locations | State | Oct-21 | Oct-20 | % Difference Month | Rolling 12 Months | Previous Rolling 12 Months | 12 Month Variance |
| Victoria | VIC | 1714 | 1534 | 11.73% | 20510 | 24854 | -17.48% |
| Greater Melbourne | VIC | 1642 | 1459 | 12.54% | 18908 | 23910 | -20.92% |
| Ballarat | VIC | 4 | 5 | -20.00% | 179 | 108 | 65.74% |
| Baw Baw | VIC | 6 | 0 | Inf | 76 | 20 | 280.00% |
| Bendigo | VIC | 4 | 3 | 33.33% | 67 | 60 | 11.67% |
| Campaspe | VIC | 0 | 2 | -100.00% | 11 | 7 | 57.14% |
| Geelong | VIC | 39 | 20 | 95.00% | 556 | 324 | 71.60% |
| Gippsland – East | VIC | 0 | 0 | NA | 10 | 0 | Inf |
| Gippsland – South West | VIC | 0 | 0 | NA | 42 | 17 | 147.06% |
| Grampians | VIC | 2 | 0 | Inf | 33 | 6 | 450.00% |
| Latrobe Valley | VIC | 2 | 0 | Inf | 26 | 48 | -45.83% |
| Melbourne – Inner East (Boroondara, Manningham, Whitehorse) | VIC | 182 | 57 | 219.30% | 2459 | 2613 | -5.89% |
| Melbourne – Inner South (Bayside, Glen Eira, Kingston, Stonnington – East) | VIC | 168 | 545 | -69.17% | 2743 | 2407 | 13.96% |
| Melbourne – Inner suburbs | VIC | 409 | 333 | 22.82% | 3795 | 9628 | -60.58% |
| Melbourne – North East (Banyule, Darebin – North, Kinglake, Whittlesea) | VIC | 266 | 164 | 62.20% | 1917 | 1879 | 2.02% |
| Melbourne – North West (Keilor, Macedon Ranges, Moreland – North, Sunbury, Tullamarine) | VIC | 169 | 63 | 168.25% | 1132 | 1128 | 0.35% |
| Melbourne – Outer East (Knox, Manningham, Maroondah, Whitehore – East, Yarra Ranges) | VIC | 116 | 106 | 9.43% | 1292 | 1328 | -2.71% |
| Melbourne – South East (Cardinia, Casey-North, Casey-South, Dandenong, Monash) | VIC | 161 | 67 | 140.30% | 1948 | 2105 | -7.46% |
| Melbourne – West (Brimbank, Hobsons Bay, Maribyrnong, Melton – Bacchus Marsh, Wyndham) | VIC | 118 | 98 | 20.41% | 3013 | 2300 | 31.00% |
| Mildura | VIC | 4 | 2 | 100.00% | 20 | 22 | -9.09% |
| Mornington Peninsula – Frankston | VIC | 53 | 26 | 103.85% | 609 | 522 | 16.67% |
| Murray River – Swan Hill | VIC | 2 | 0 | Inf | 21 | 6 | 250.00% |
| Shepparton | VIC | 0 | 1 | -100.00% | 38 | 16 | 137.50% |
| Surf Coast – Bellarine Peninsula | VIC | 6 | 36 | -83.33% | 191 | 222 | -13.96% |
| Upper Goulburn Valley | VIC | 0 | 2 | -100.00% | 32 | 28 | 14.29% |
| Wangaratta – Benalla | VIC | 0 | 2 | -100.00% | 64 | 16 | 300.00% |
| Warrnambool | VIC | 0 | 0 | NA | 94 | 6 | 1466.67% |
| Wellington | VIC | 0 | 0 | NA | 26 | 4 | 550.00% |
| Wodonga – Alpine | VIC | 3 | 0 | Inf | 25 | 4 | 525.00% |
| New South Wales | NSW | 2172 | 2707 | -19.76% | 32338 | 24152 | 33.89% |
| Greater Sydney | NSW | 1665 | 2319 | -28.20% | 26490 | 20011 | 32.38% |
| Albury | NSW | 5 | 0 | Inf | 43 | 48 | -10.42% |
| Bathurst | NSW | 4 | 2 | 100.00% | 36 | 74 | -51.35% |
| Central Coast | NSW | 72 | 20 | 260.00% | 559 | 421 | 32.78% |
| Coffs Harbour | NSW | 45 | 29 | 55.17% | 201 | 87 | 131.03% |
| Dapto – Port Kembla | NSW | 126 | 6 | 2000.00% | 247 | 264 | -6.44% |
| Dubbo | NSW | 14 | 4 | 250.00% | 87 | 63 | 38.10% |
| Gosford | NSW | 45 | 7 | 542.86% | 356 | 222 | 60.36% |
| Goulburn | NSW | 14 | 20 | -30.00% | 68 | 70 | -2.86% |
| Griffith | NSW | 4 | 4 | 0.00% | 30 | 16 | 87.50% |
| Kiama – Shellharbour | NSW | 42 | 30 | 40.00% | 785 | 361 | 117.45% |
| Lake Macquarie | NSW | 88 | 55 | 60.00% | 469 | 308 | 52.27% |
| Lower Hunter | NSW | 8 | 2 | 300.00% | 135 | 46 | 193.48% |
| Maitland | NSW | 8 | 46 | -82.61% | 364 | 397 | -8.31% |
| Newcastle | NSW | 14 | 68 | -79.41% | 810 | 568 | 42.61% |
| Orange | NSW | 11 | 4 | 175.00% | 70 | 37 | 89.19% |
| Port Macquarie | NSW | 20 | 41 | -51.22% | 230 | 186 | 23.66% |
| Port Stephens | NSW | 4 | 0 | Inf | 291 | 72 | 304.17% |
| Rest of NSW | NSW | 507 | 388 | 30.67% | 5848 | 4141 | 41.22% |
| Richmond – Tweed | NSW | 31 | 6 | 416.67% | 369 | 301 | 22.59% |
| Shoalhaven | NSW | 2 | 37 | -94.59% | 204 | 296 | -31.08% |
| South Coast – Batemas Bay, Bega, Merimbula | NSW | 0 | 8 | -100.00% | 45 | 104 | -56.73% |
| Southern Highlands | NSW | 0 | 0 | NA | 234 | 31 | 654.84% |
| Sutherland | NSW | 47 | 79 | -40.51% | 1134 | 776 | 46.13% |
| Sydney – Baulkham Hills and Hawkesbury | NSW | 163 | 387 | -57.88% | 1632 | 882 | 85.03% |
| Sydney – Blacktown | NSW | 356 | 528 | -32.58% | 4586 | 2116 | 116.73% |
| Sydney – City and Inner South | NSW | 50 | 331 | -84.89% | 3360 | 1626 | 106.64% |
| Sydney – Eastern Suburbs (Bondi, Coogee, Randwick) | NSW | 111 | 66 | 68.18% | 551 | 461 | 19.52% |
| Sydney – Inner South West (Bankstown, Cantebury, Hurtsville) | NSW | 130 | 178 | -26.97% | 2117 | 3070 | -31.04% |
| Sydney – Inner West (Canada Bay, Leichhardt, Strathfield) | NSW | 24 | 23 | 4.35% | 1088 | 1340 | -18.81% |
| Sydney – North Sydney (Chatswood, Hornsby, Mosman) | NSW | 57 | 124 | -54.03% | 746 | 1103 | -32.37% |
| Sydney – Northern Beaches (Manly, Pittwater, Warringah) | NSW | 3 | 74 | -95.95% | 424 | 274 | 54.74% |
| Sydney – Outer South West (Camden, Campbelltown, Wollondilly) | NSW | 32 | 12 | 166.67% | 894 | 794 | 12.59% |
| Sydney – Parramatta | NSW | 216 | 30 | 620.00% | 5475 | 4178 | 31.04% |
| Sydney – Penrith, Richmond, Blue Mountains | NSW | 37 | 23 | 60.87% | 589 | 640 | -7.97% |
| Sydney – Ryde | NSW | 262 | 58 | 351.72% | 2357 | 597 | 294.81% |
| Sydney – South West (Bringelly, Fairfield, Liverpool) | NSW | 105 | 386 | -72.80% | 978 | 1733 | -43.57% |
| Tamworth | NSW | 18 | 0 | Inf | 65 | 65 | 0.00% |
| Taree – Gloucester | NSW | 4 | 0 | Inf | 51 | 64 | -20.31% |
| Wagga Wagga | NSW | 5 | 4 | 25.00% | 76 | 49 | 55.10% |
| Wollongong | NSW | 6 | 20 | -70.00% | 487 | 443 | 9.93% |
| Wyong | NSW | 27 | 13 | 107.69% | 203 | 199 | 2.01% |
| Australian Capital Territory | ACT | 220 | 334 | -34.13% | 3482 | 3689 | -5.61% |